With momentum indicators hinting at subtle strength beneath the surface, Pi might be gearing up for an explosive breakout.
Mixed Signals in Money Flow – Accumulation or Distribution?
The recent Money Flow Index (MFI) reading of 56.67 places Pi in a neutral-to-bullish zone, suggesting moderate buying pressure without signs of overheating.
This level indicates that investors have been steadily accumulating since early October, maintaining healthy inflows.

Source: TradingView
However, the Chaikin Money Flow (CMF) sits at -0.14, implying that some capital continues to flow out of the asset.
This divergence suggests a tug-of-war between buyers and sellers. A move in the CMF back above zero could confirm a bullish shift in money flow.
PI Price Analysis: A Rare Falling Channel Pattern
The daily chart reveals Pi trading within a long-term falling channel pattern, typically considered a bullish reversal formation.
The price has tested the lower trendline multiple times while maintaining higher lows on the RSI.
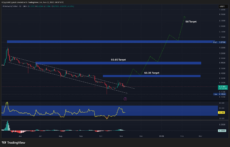
Source: TradingView
If Pi manages to break above the upper boundary of the channel with volume confirmation, the first major resistance lies at $0.35, followed by $0.65.
A sustained breakout beyond these zones could open the door to a much larger move toward the $4 target, marking a potential multi-month reversal.
Beginning of Rally?
With the immediate support in the $0.17–$0.15 zone and short-term targets at $0.35 and $0.65, Pi Coin is currently in a state of quiet accumulation, supported by moderate money inflows and a technical setup that hints at a possible bullish breakout.