Key points:
Bitcoin has remained above the $100,000 level on a closing basis, but the risk of a breakdown remains until the price rises above $108,000.
Several major altcoins are holding onto their support levels, but a weak bounce heightens the risk of a breakdown.
Bitcoin ( BTC ) has risen above $101,000, indicating that the bulls are aggressively defending the $100,000 support. Several analysts say that BTC may bottom near $100,000, but Bloomberg analyst Mike McGlone said in a post on X that BTC could collapse to $56,000 .
However, not everyone is bearish on BTC. JPMorgan analysts said in a report that BTC is trading below its fair value based on the bitcoin-to-gold volatility ratio. The analysts project BTC to rally to about $170,000 over the next six to 12 months.
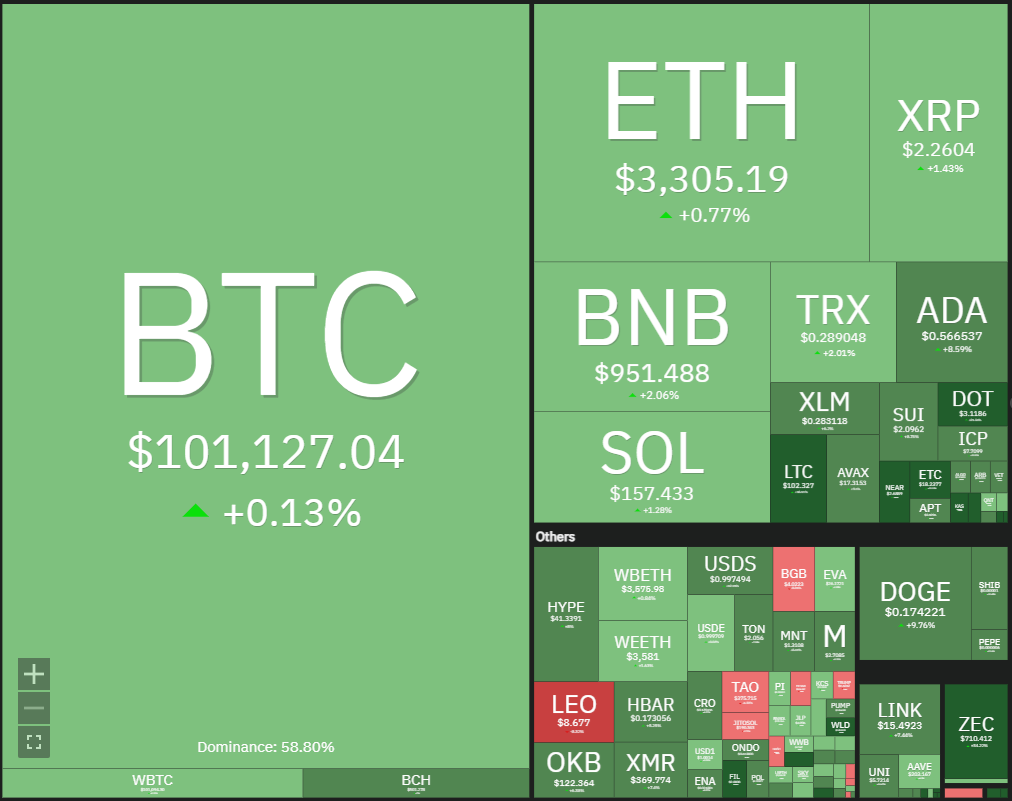 Crypto market data daily view: Source: Coin360
Another positive for BTC could be the strong underlying demand for BTC exchange-traded funds (ETFs). Brokerage giant Schwab Asset Management said in a recent report that 45% of its respondents expressed interest in buying a crypto ETF, matching the number of investors who wanted to buy a bond ETF.
What are the crucial support levels to watch for in BTC and the major altcoins? Let's analyze the charts of the top 10 cryptocurrencies to find out.
Bitcoin price prediction
BTC bulls have successfully defended the $100,000 level on a closing basis, but the bears have continued to exert pressure.
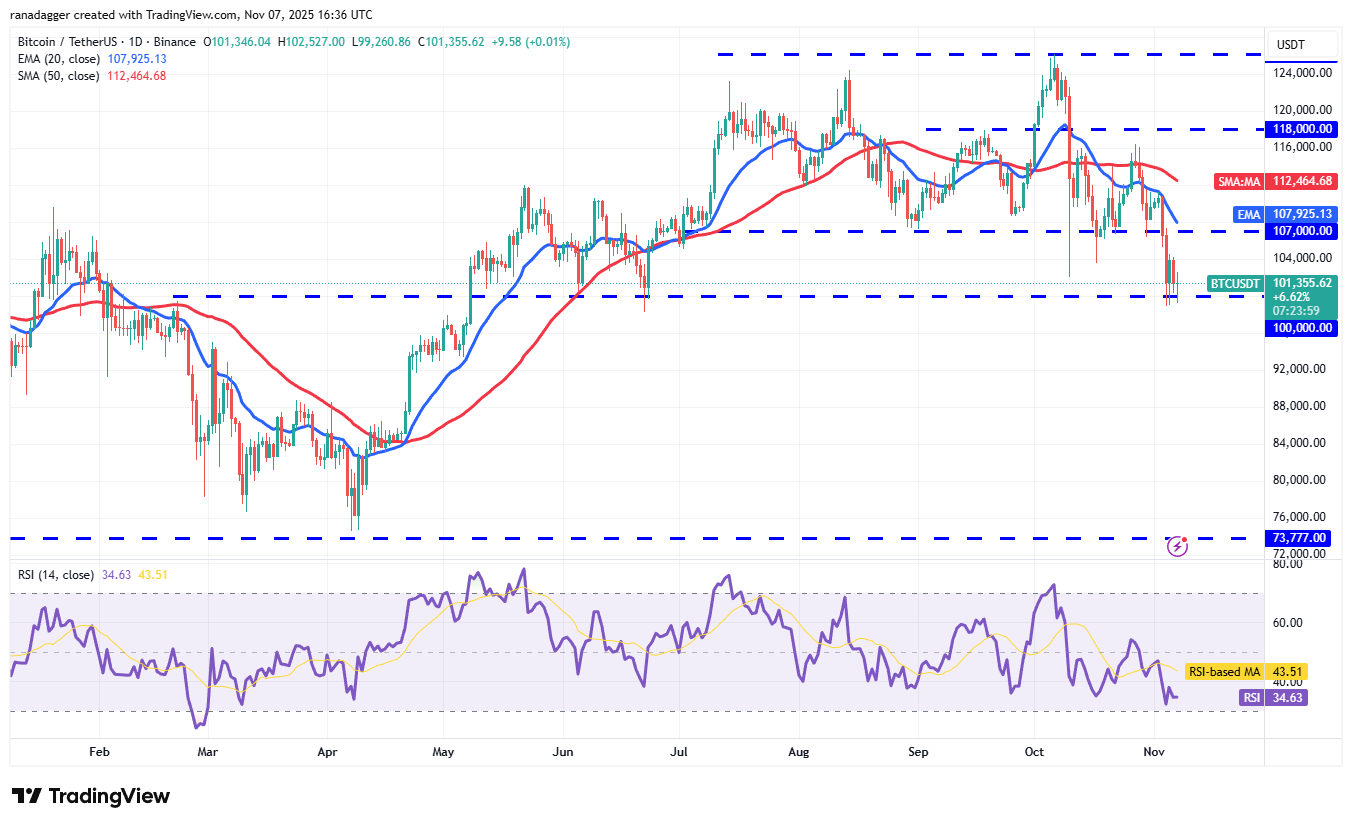 BTC/USDT daily chart: Source: Cointelegraph/ TradingView
Buyers will have to swiftly push the price above the 20-day exponential moving average (EMA) ($107,925) to signal strength. If they manage to do that, the BTC/USDT pair could climb to the 50-day simple moving average (SMA) ($112,464).
The bears are likely to have different plans. They will sell on rallies and attempt to yank the Bitcoin price below the $100,000 support. If that happens, the pair could start a deeper correction toward $87,800.
Ether price prediction
Ether ( ETH ) has been witnessing a tough battle between the buyers and sellers at the $3,350 level.
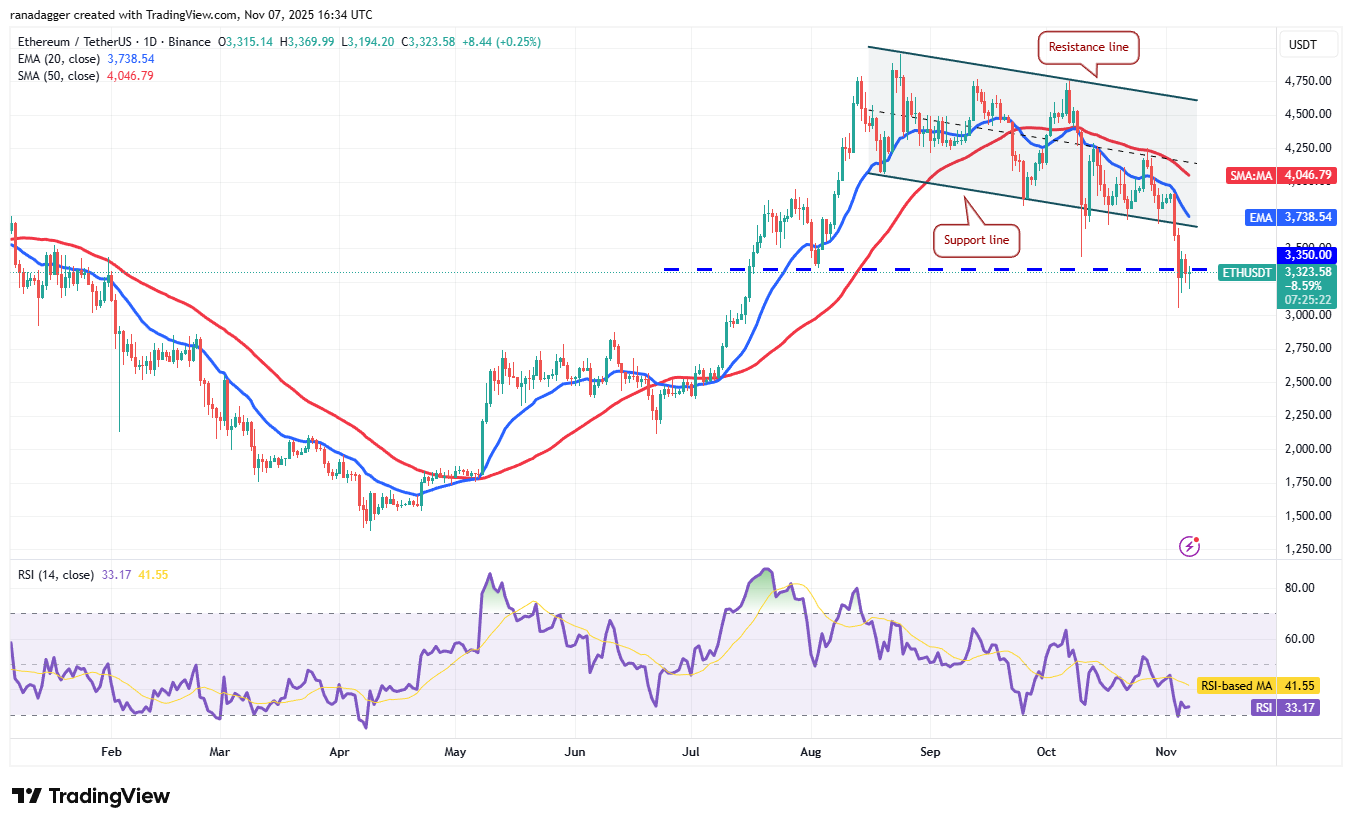 ETH/USDT daily chart: Source: Cointelegraph/TradingView
A weak recovery increases the risk of a further downside. If the price turns down from the current level or the 20-day EMA ($3,738) and breaks below $3,057, it signals the start of a new downtrend. The Ether price could then plunge toward $2,500.
Buyers will have to drive the price above the moving average to prevent the downside. The ETH/USDT pair could then climb to the resistance line of the channel, suggesting that the corrective phase may be over.
BNB price prediction
BNB ( BNB ) is attempting to start a recovery, but the weak rebound suggests a lack of demand at higher levels.
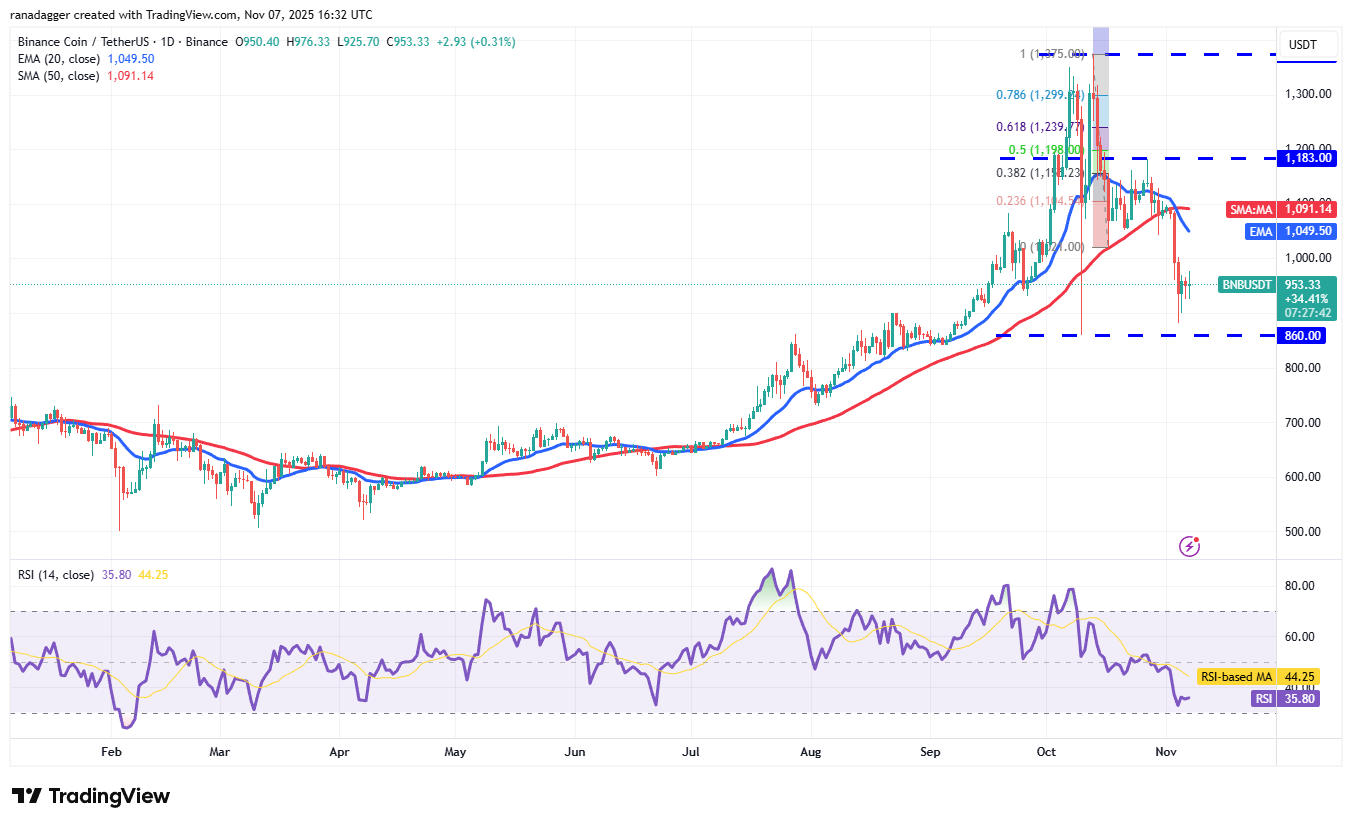 BNB/USDT daily chart: Source: Cointelegraph/TradingView
The 20-day EMA ($1,049) has started to turn down, and the relative strength index (RSI) is in negative territory, indicating advantage to sellers. If the price turns down from the 20-day EMA, the bears will again try to pull the BNB/USDT pair below $860. If they succeed, the pair could descend to $730.
On the contrary, if the $860 level holds and the bulls push the price above the 20-day EMA, the pair could form a range. The BNB price may swing from $860 to $1,183.
XRP price prediction
XRP ( XRP ) attempted a relief rally on Thursday, but the bulls could not clear the overhead hurdle at the 20-day EMA ($2.42).
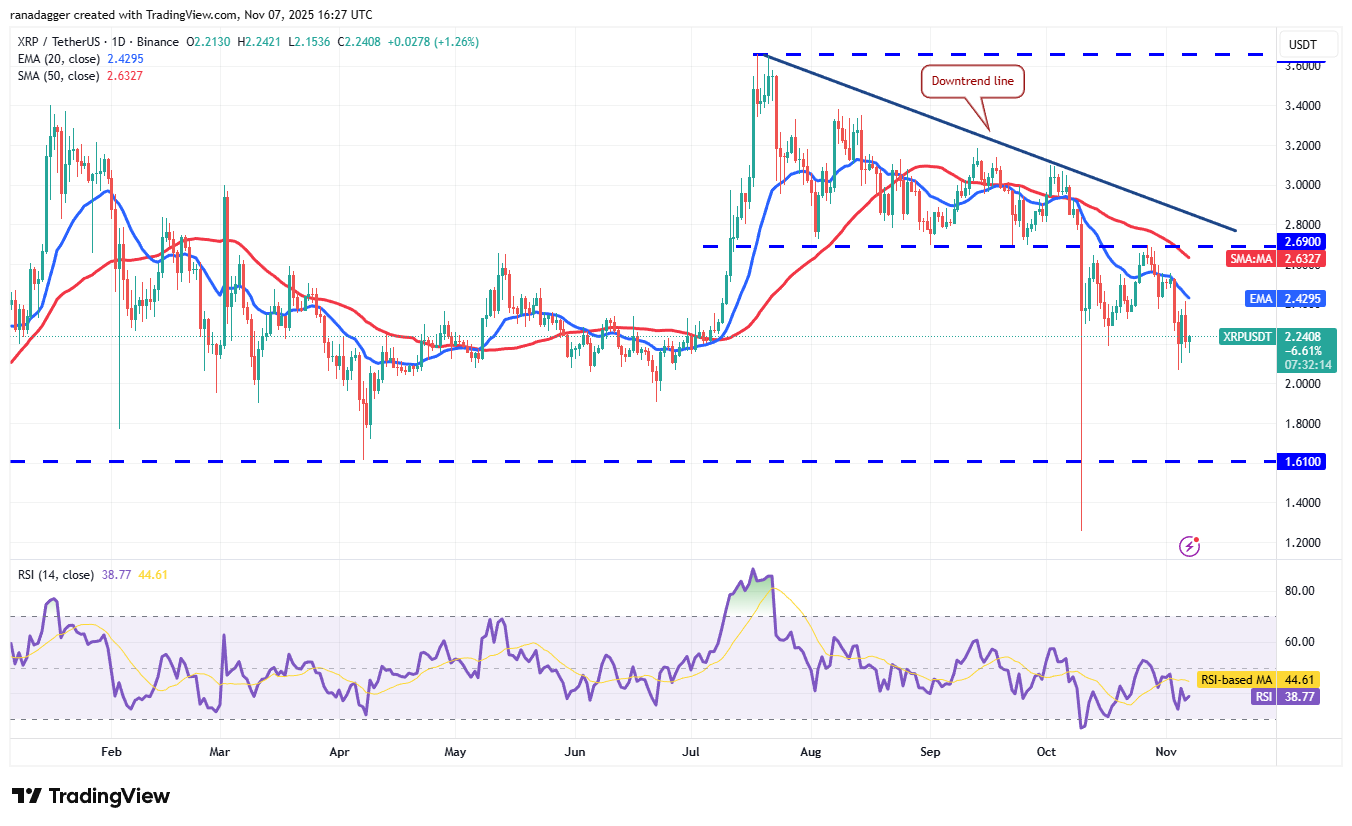 XRP/USDT daily chart: Source: Cointelegraph/TradingView
The bears will try to sink the XRP price below the $2.06 level. If they can pull it off, the XRP/USDT pair could resume its downtrend toward $1.90 and then to firm support at $1.61.
Contrary to this assumption, if the price turns up and breaks above the 20-day EMA, it signals demand at lower levels. The pair may then climb to the 50-day SMA ($2.63) and later to the downtrend line.
Solana price prediction
Buyers are attempting to maintain Solana ( SOL ) above the $155 level, but the shallow bounce suggests the bears are selling on minor rallies.
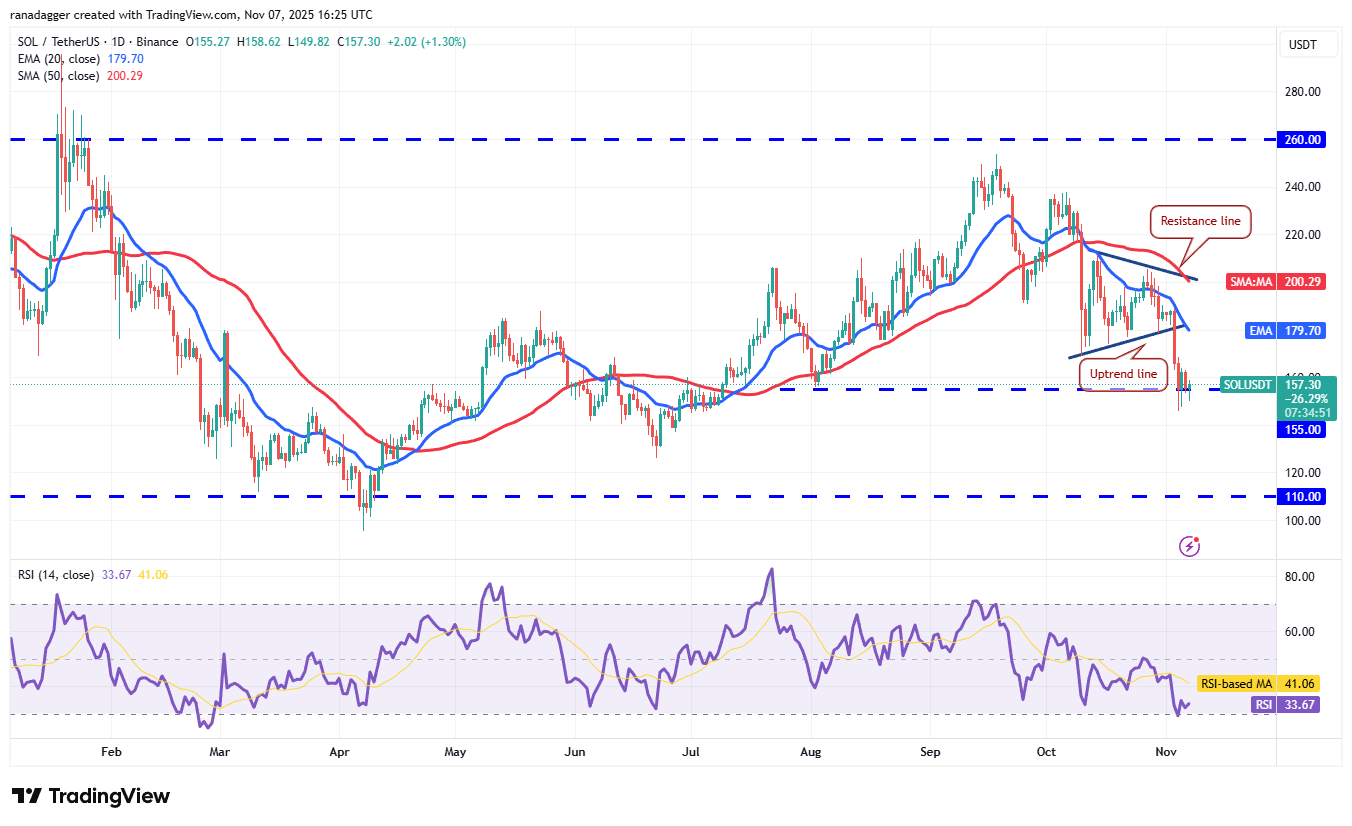 SOL/USDT daily chart: Source: Cointelegraph/TradingView
If the price turns down and closes below $155, the SOL/USDT pair could start the next leg of the downward move. The Solana price could descend to $126 and subsequently to the solid support at $110.
On the contrary, if the price rises and breaks above $164, the pair could reach the 20-day EMA ($179). The bulls will have to drive the pair above the 20-day EMA to weaken the bearish momentum.
Dogecoin price prediction
Dogecoin ( DOGE ) is attempting to start a recovery, which is expected to face selling at the 20-day EMA ($0.18).
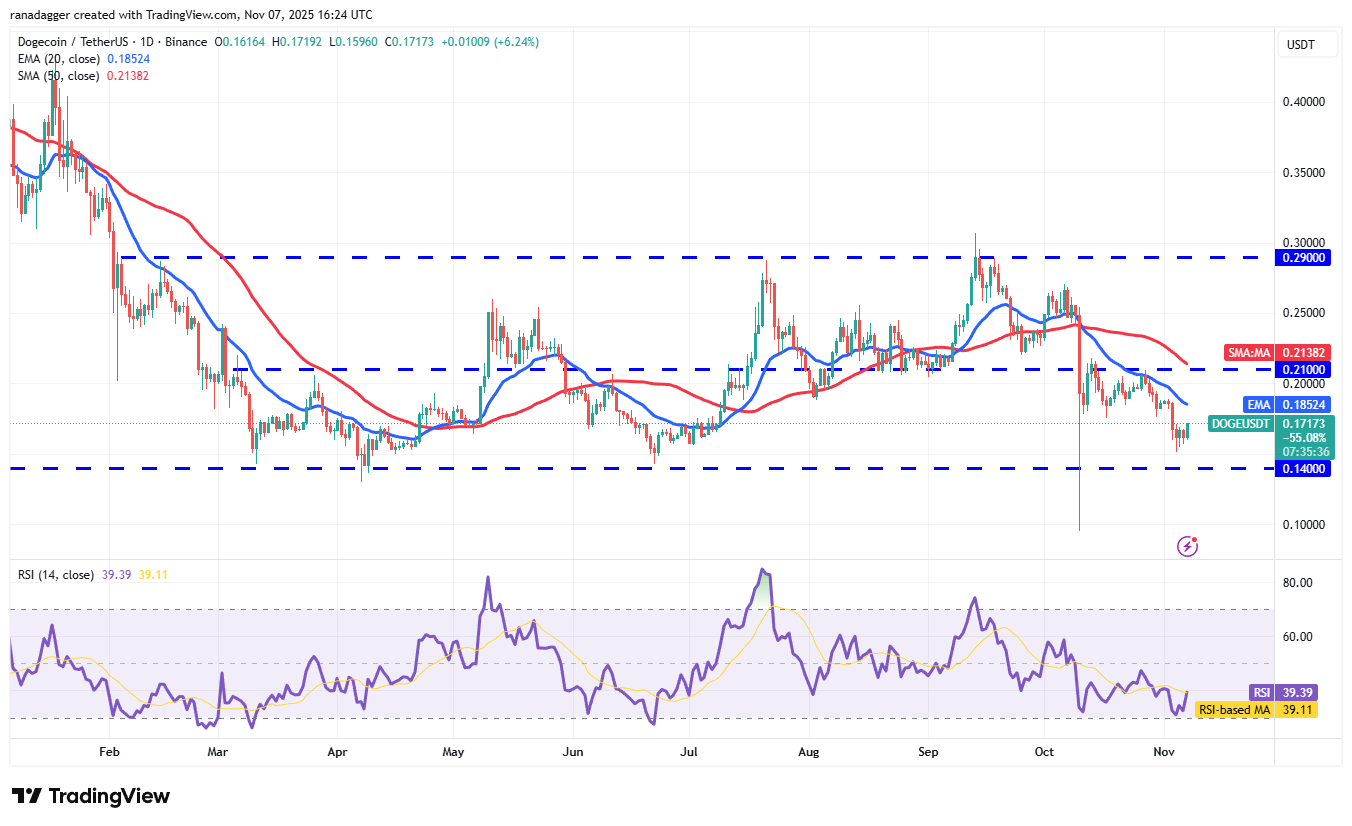 DOGE/USDT daily chart: Source: Cointelegraph/TradingView
If the price turns down from the 20-day EMA, it signals that the sentiment remains negative and the bears are selling on rallies. The DOGE/USDT pair could then plummet to solid support at $0.14.
Contrarily, if the price breaks above the 20-day EMA, the rally could extend to the $0.21 level. Such a move suggests that the Dogecoin price could remain inside the $0.14 to $0.29 range for some more time.
Cardano price prediction
Buyers have successfully defended the $0.50 support in Cardano ( ADA ), but the recovery lacks strength.
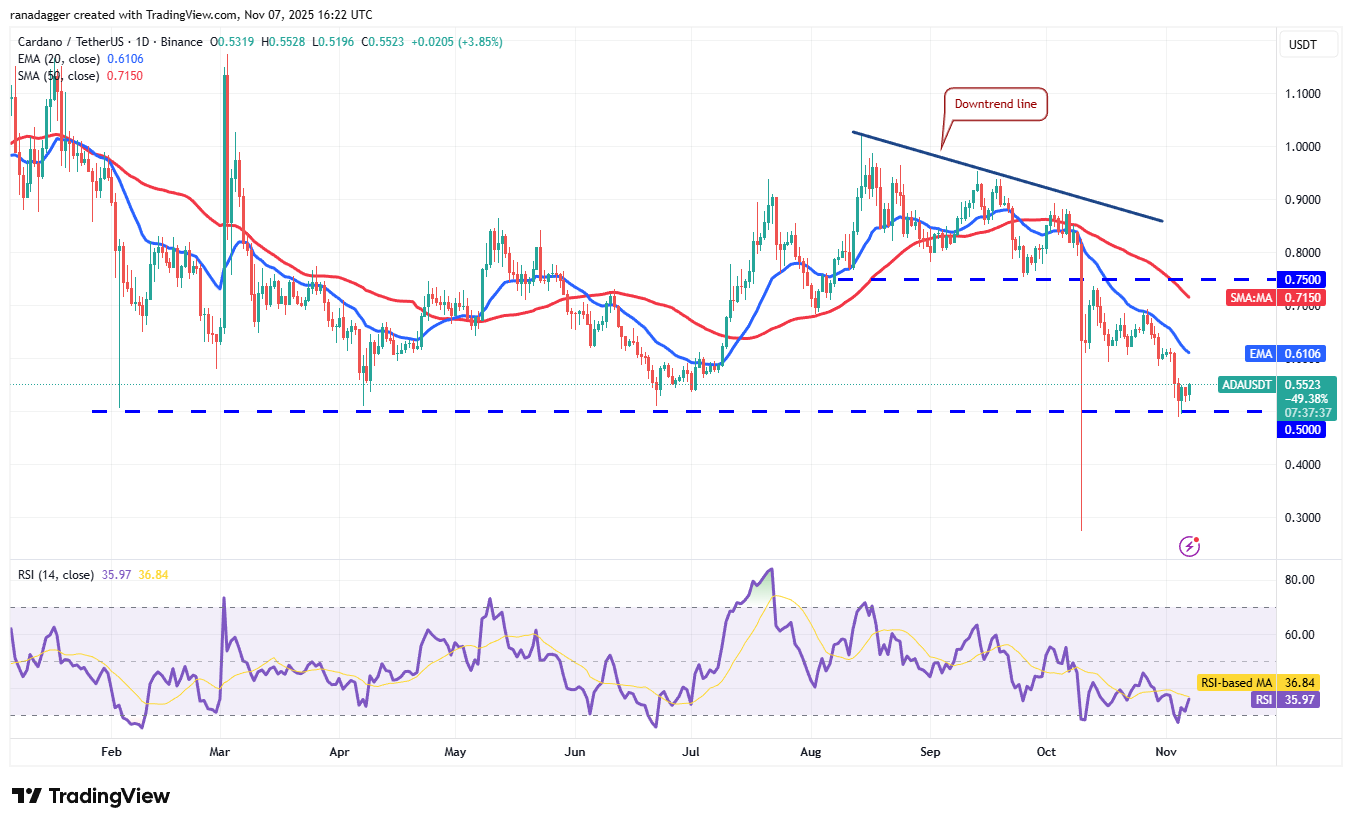 ADA/USDT daily chart: Source: Cointelegraph/TradingView
Sellers will attempt to stall the relief rally at the 20-day EMA ($0.61). If the price turns down from the 20-day EMA, the risk of a break below the $0.50 level increases. A close below $0.50 opens the doors for a decline to $0.40.
The bulls will have to propel the Cardano price above the 20-day EMA to signal a comeback. The ADA/USDT pair could then climb to the breakdown level of $0.75 and eventually to the downtrend line.
Related: XRP price slips despite Ripple’s bullish Swell announcements: Is $2 next?
Hyperliquid price prediction
Buyers tried to push Hyperliquid (HYPE) above the 20-day EMA ($41.77) on Wednesday, but the bears held their ground.
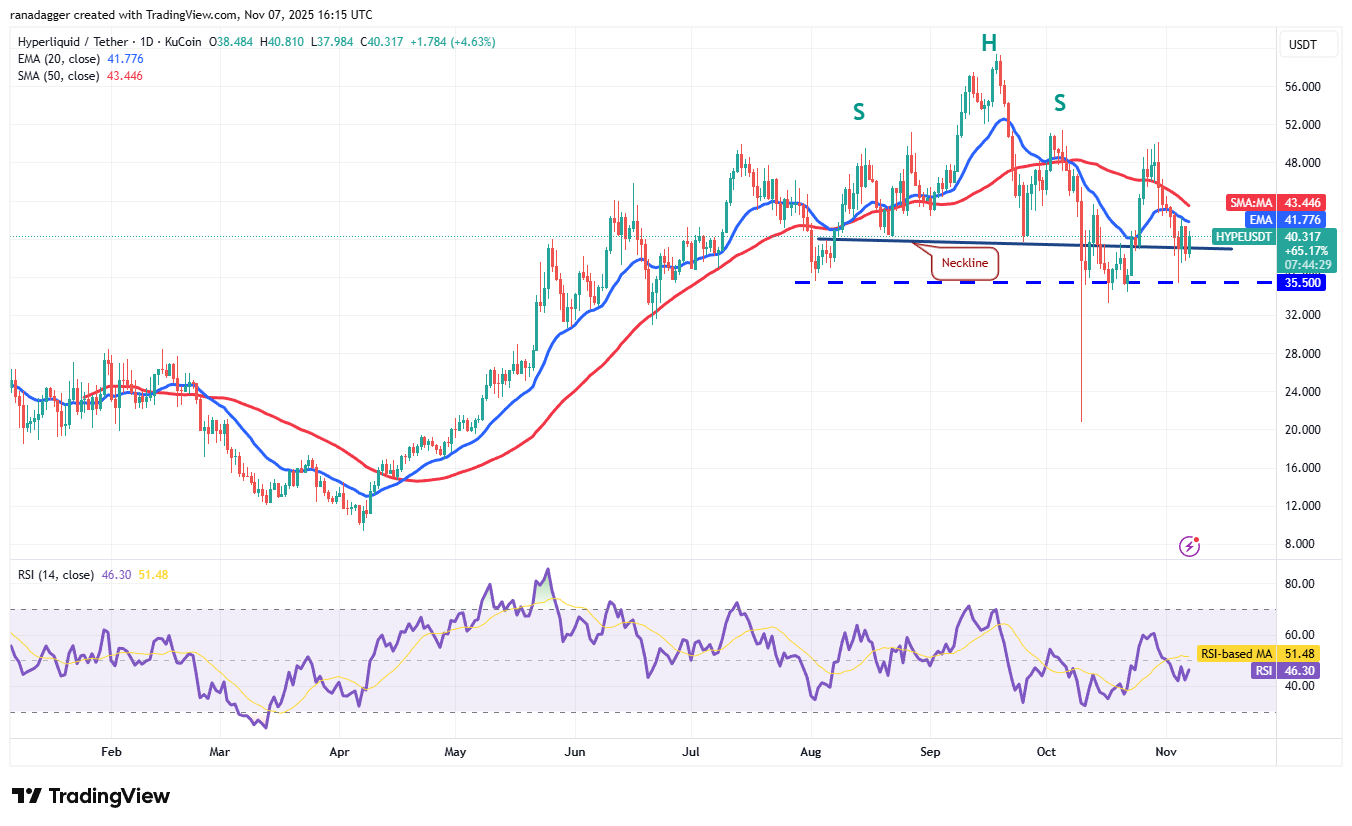 HYPE/USDT daily chart: Source: Cointelegraph/TradingView
The bulls are again attempting to push the Hyperliquid price above the moving averages. If they manage to do that, the HYPE/USDT pair could rally to $52. Buyers are expected to face significant selling pressure near the $52 resistance. If the price turns down sharply from the overhead resistance, the pair may consolidate between $35.50 and $52 for a while.
Sellers will have to sink the price below the $35.50 level to gain the upper hand. The pair may then slump to $30.50 and later to $28.
Chainlink price prediction
Buyers are trying to start a relief rally in Chainlink ( LINK ), but the bears have not allowed the price to close above $15.43.
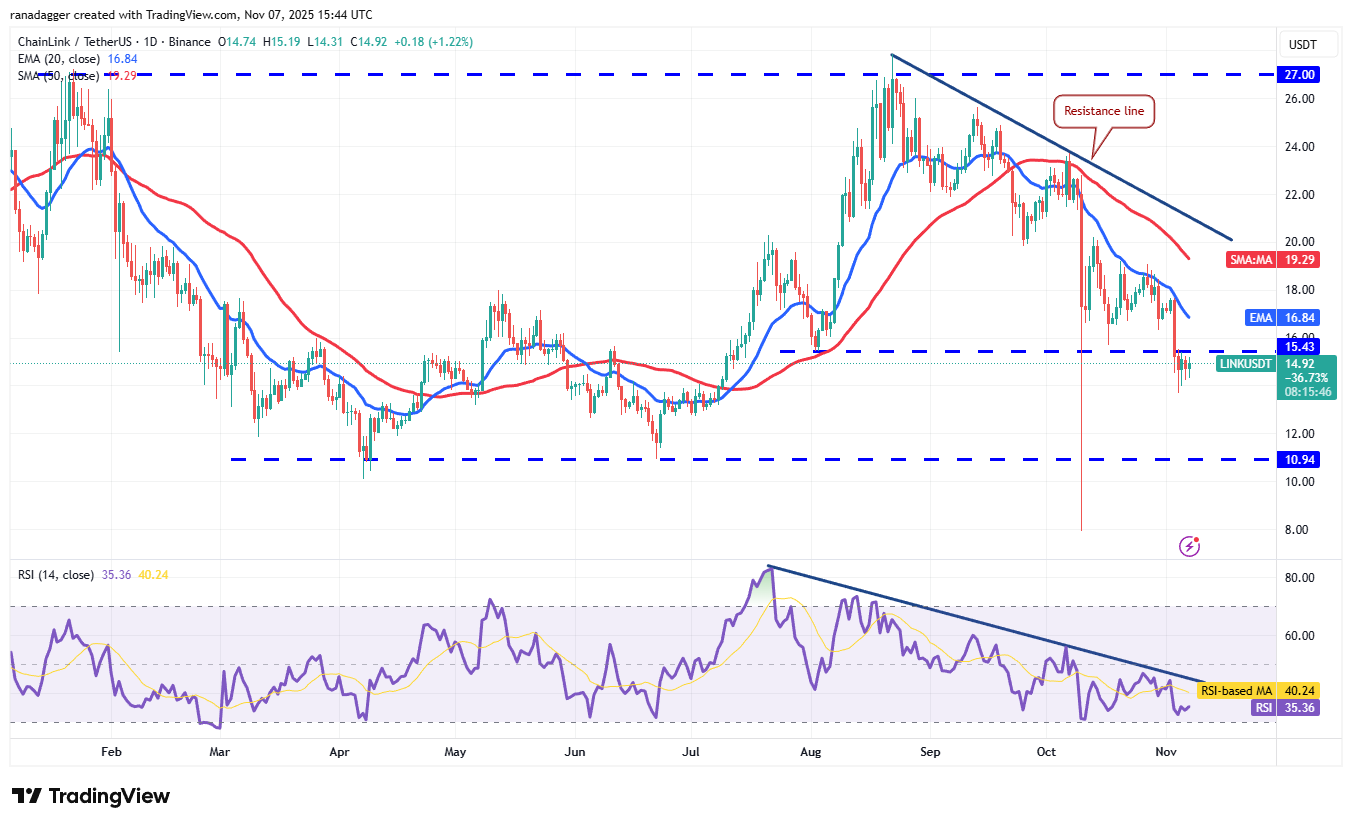 LINK/USDT daily chart: Source: Cointelegraph/TradingView
A shallow bounce heightens the risk of a further fall. If the price turns down and breaks below $13.69, it signals the resumption of the downward move. The Chainlink price could tumble to $12.73 and then to $10.94.
Instead, if the price closes above $15.43, the LINK/USDT pair could reach the 20-day EMA ($16.84). The bulls will have to kick the price above the 20-day EMA to clear the path for a rally to the resistance line.
Zcash price prediction
Zcash ( ZEC ) has been on a tear in the past few days, signaling sustained demand from the bulls at every higher level.
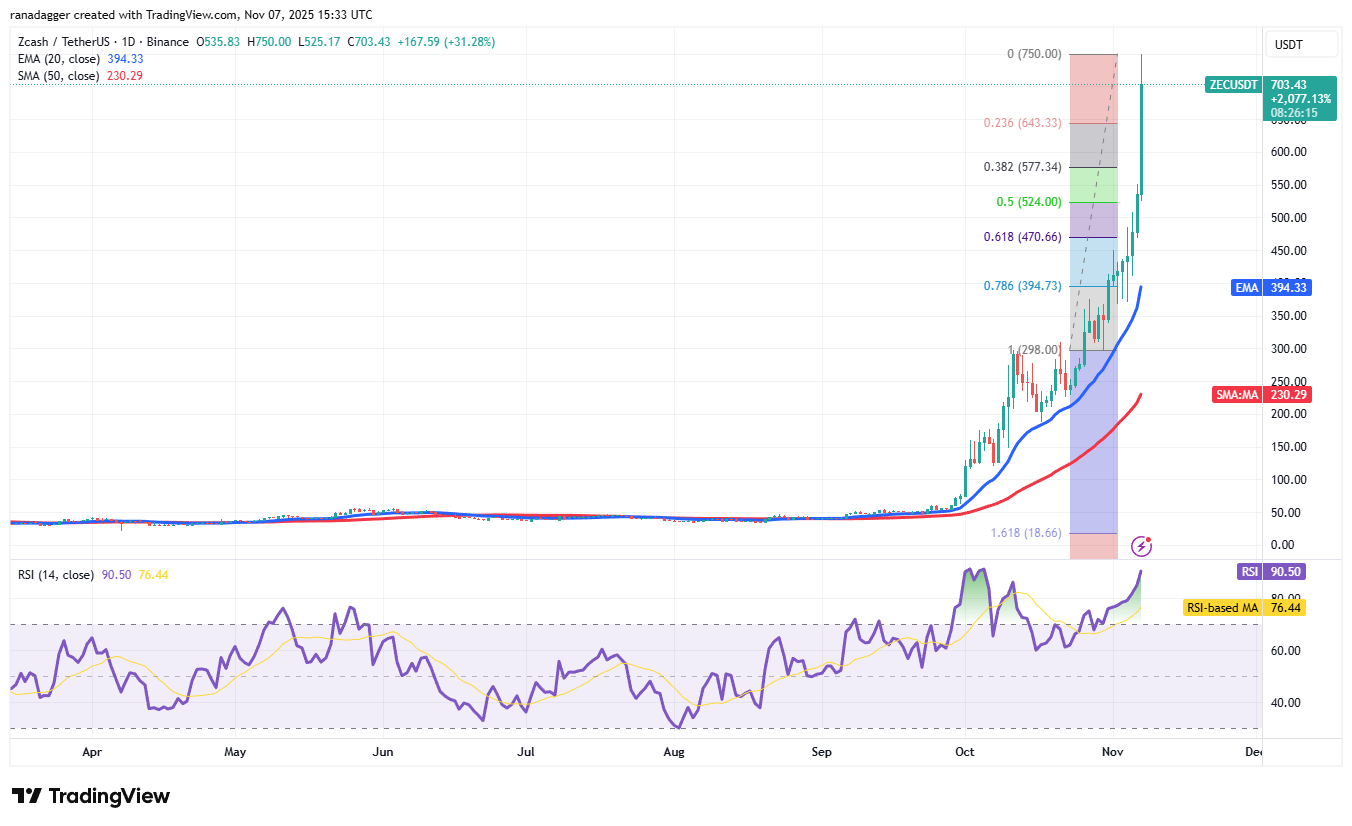 ZEC/USDT daily chart: Source: Cointelegraph/TradingView
The rally has pushed the RSI deep into the overbought territory, signaling that the up move is overextended in the near term. That suggests a possible pullback or consolidation, as vertical rallies are rarely sustainable.
The first support on the downside is the 38.2% Fibonacci retracement level of $577, and then the 50% retracement level of $524. If the ZEC price rebounds off the support, the bulls will attempt to push the ZEC/USDT pair to $830.