BREAKING News: Bitcoin Crashes Below $100,000 as Panic Selling Intensifies

Bitcoin Price Breaks 100K: A Critical Psychological Level Lost
$Bitcoin has officially broken below the $100,000 psychological support, sending shockwaves across the crypto market . The 4H chart shows a sharp rejection from the $104K–106K resistance zone, followed by a steep selloff that accelerated once BTC slipped under the yellow support area.
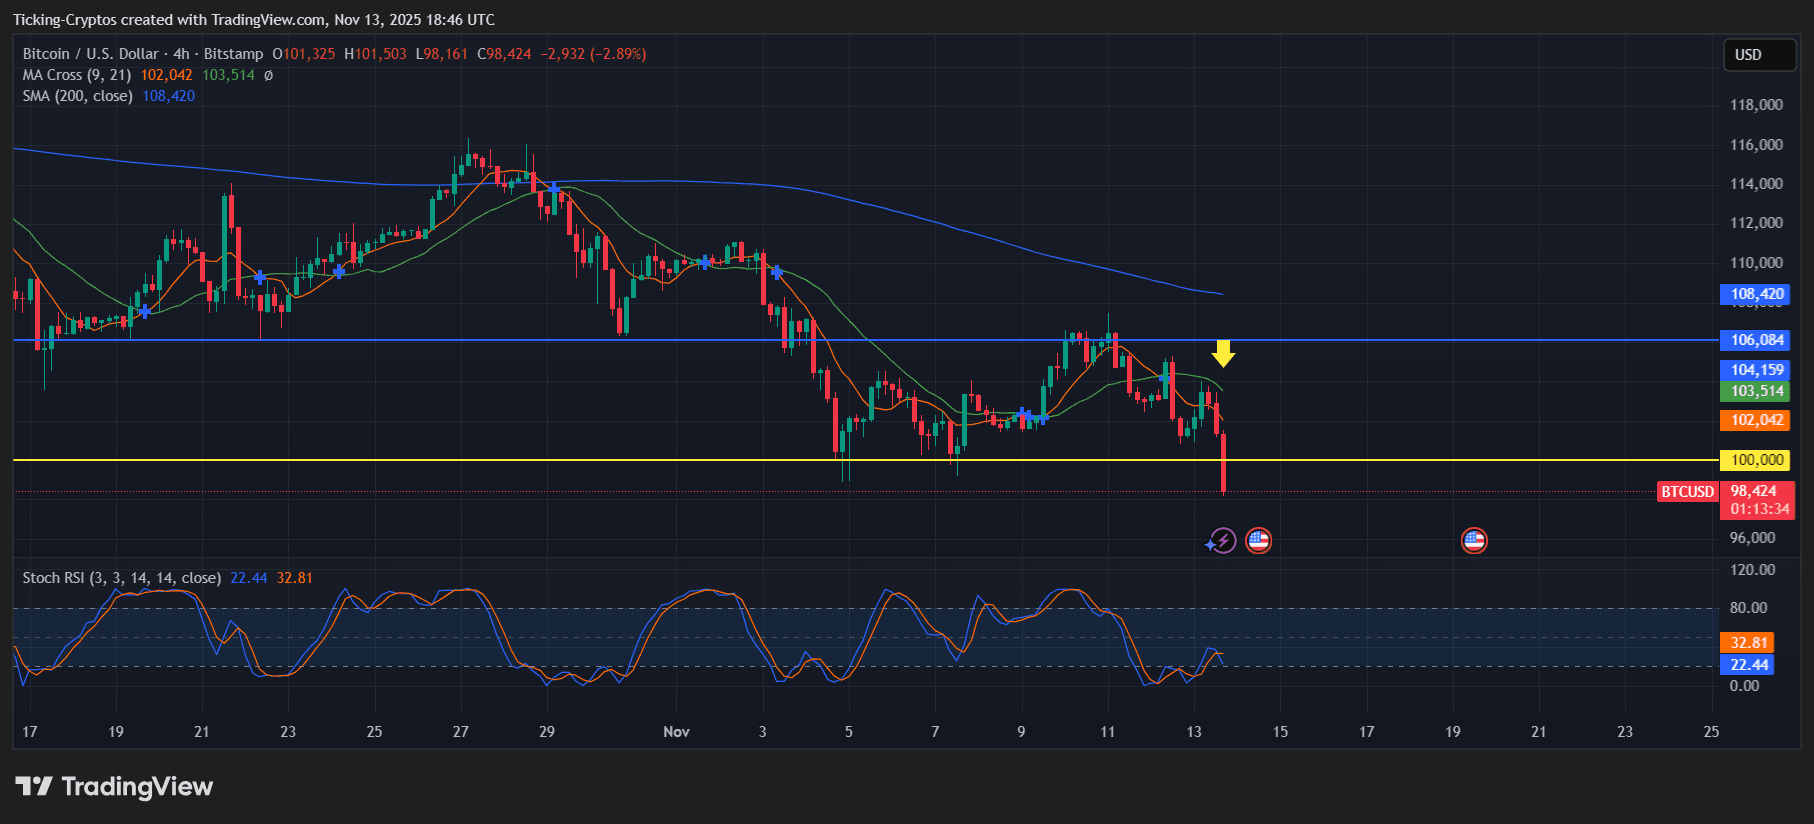
BTC/USD 4-hours chart - TradingView
The break below $100K wasn’t just technical—it triggered panic selling, liquidations, and a massive imbalance in the order book, all visible in the depth chart.
$BTC is now trading around $98,500, with fear rising rapidly as traders reassess downside risks.
Bitcoin Crash: BTC Loses Structure and Re-Tests Local Lows
1. Major resistance rejection
On the 4H chart:
- BTC attempted to reclaim the $104K–106K zone, but the rejection (highlighted by your yellow arrow) confirmed strong seller dominance.
- Moving averages (9/21 EMA cross) remain bearish.
- Price quickly accelerated toward the next major support: $100K.
2. Support finally breaks
The long-tested horizontal zone at $100,000 has acted as:
- A psychological barrier
- A liquidity magnet
- A momentum pivot
Once price slipped under it, the market reacted violently.
3. Momentum indicators signal oversold
Stoch RSI is diving into oversold territory, suggesting short-term exhaustion—
…but not enough yet to prevent further downside if liquidity gets swept.
Depth Chart Analysis: Heavy Sell-Side Pressure
The depth chart clearly shows:
- Massive buy liquidity from 99K → 95K wiped out
- Increasing sell walls from $102K–105K
The order book shows a strong imbalance:
Buy-side liquidity (green):
- Deep stack down at $98K–96K
- Thinner liquidity as you approach $100K → meaning less support to stop crashes
Sell-side liquidity (red):
- Thick sell walls starting at $102K
- Strong bearish pressure preventing a quick recovery
- This confirms stronger sellers than buyers, signaling that BTC may not reclaim $100K immediately.
Bitcoin Price Prediction: What Comes After the Crash?
Immediate Support Levels
🔻 $98,300 – first bounce zone: (This area appears in both the trading chart and depth chart as a large liquidity pocket.)
🔻 $96,000 – $95,500: Stronger buy liquidity zone. If BTC continues falling, this is the next major support.
🔻 $92,000 – $90,000: A complete liquidity sweep may target this region if panic selling accelerates.
Upside Recovery Targets
If BTC manages to reclaim $100K:
🔼 $102,000 – $103,500: First resistance cluster (21 EMA + sell wall)
🔼 $104,000 – $106,000: The key area where BTC was previously rejected. Must be broken to regain bullish structure.
🔼 $108,400: 200 SMA resistance on the 4H—major trend confirmation point.
Market Sentiment: Fear Is Rising, But Opportunity Brewing?
The break below $100K triggered:
- Liquidations
- Panic exits
- Social sentiment collapse
- Derivatives funding flipping negative
However, structurally:
- BTC is still in a macro uptrend
- $96K–$98K has strong spot demand
- Whales historically accumulate during shakeouts
- Short-term pain is possible, but long-term buyers may see this as a rare dip.
Disclaimer: The content of this article solely reflects the author's opinion and does not represent the platform in any capacity. This article is not intended to serve as a reference for making investment decisions.
You may also like
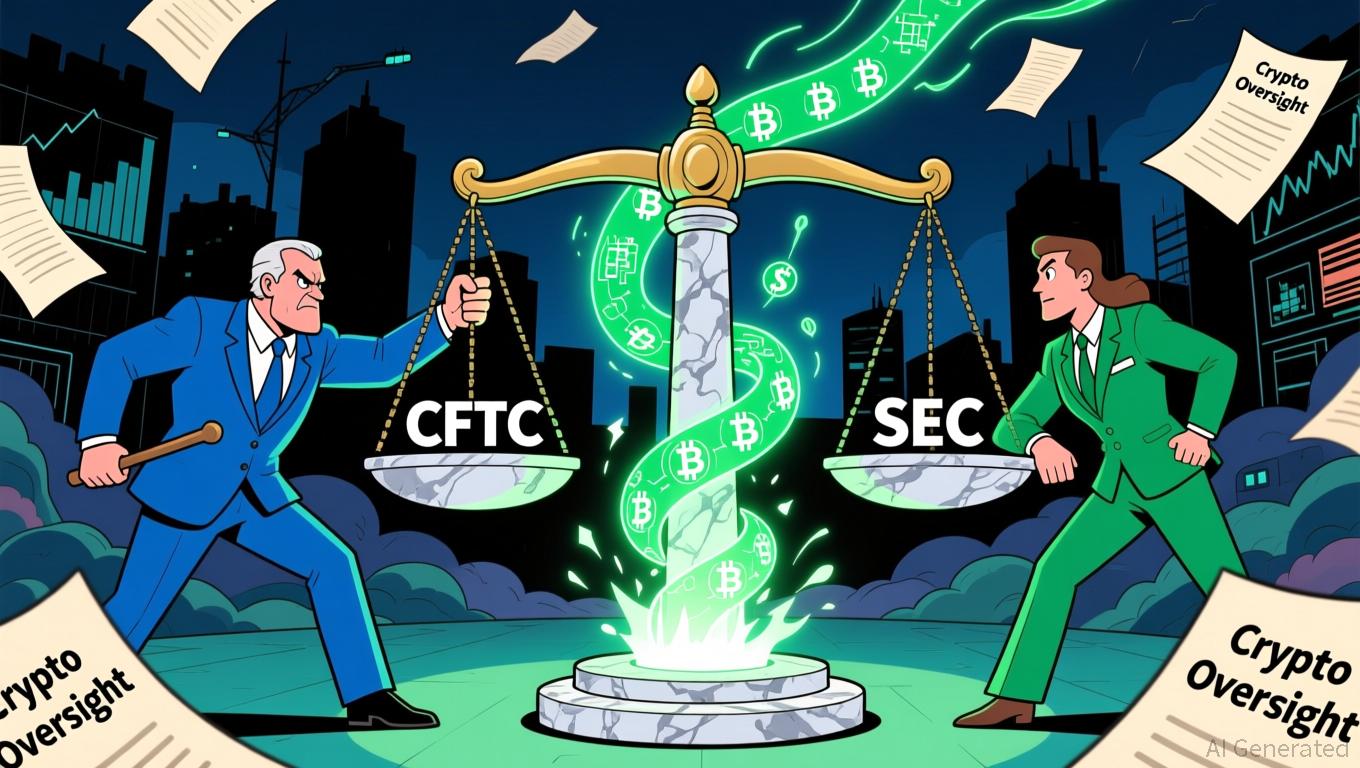
Bitcoin News Update: CFTC's Broader Role in Crypto Regulation Ignites Discussion on Clearer Rules
- U.S. lawmakers propose expanding CFTC's crypto oversight via a bill reclassifying spot trading, diverging from SEC's enforcement approach. - Harvard University invests $443M in BlackRock's IBIT ETF, reflecting institutional confidence in crypto as a legitimate asset class. - DeFi projects like Mutuum Finance raise $18.7M in presales, leveraging regulatory momentum and transparent on-chain credit systems. - RockToken's infrastructure-backed crypto contracts attract long-term investors with structured yiel
DASH Aster DEX's Latest On-Chain Growth and What It Means for DeFi Liquidity
- DASH Aster DEX leads 2025 DeFi shift with hybrid AMM-CEX model and multi-chain support (BNB, Ethereum , Solana), boosting TVL to $1.399B and Q3 daily trading volumes of $27.7B. - Platform's 1,650% ASTER token price surge post-TGE attracted 330,000 new wallets, with 94% of BSC-USD volume ($2B/day) driving institutional adoption via Binance/YZi partnerships. - ASTER token mechanics enable 80% margin trading, 5-7% staking rewards, and governance rights, while annual 5-7% fee burns create scarcity and align

Astar 2.0: Leading a New Generation of DeFi and Cross-Chain Advancements
- Astar 2.0 introduces a zkEVM mainnet and cross-chain interoperability, slashing gas fees and enabling 150,000 TPS with 2025 scalability goals. - Strategic partnerships with Mazda, Japan Airlines, and Sony demonstrate blockchain's real-world applications in logistics, loyalty programs, and digital asset tokenization. - Q3 2025 data shows $2.38M DeFi TVL growth and 20% active wallet increase, alongside a $3.16M institutional ASTR token acquisition. - The platform aims to solidify its role as a foundational

Aster DEX Introduces New On-Ramp: Transforming Retail Participation in DeFi
- Aster DEX integrates institutional-grade custody and privacy tech (zero-knowledge proofs) to bridge retail-institutional DeFi gaps via BNB Chain partnerships. - TVL surged to $2.18B by late 2025 through yield-bearing stablecoins and hidden orders, attracting both retail and institutional liquidity. - Despite compliance gaps and wash trading concerns, Aster's Binance alignment and Coinbase listing signals growing institutional validation.