Date: Fri, Nov 14, 2025 | 06:58 AM GMT
The cryptocurrency market continues to face heavy selling pressure as both Bitcoin (BTC) and Ethereum (ETH) plunged over 7% and 11% respectively in the past 24 hours. The correction triggered more than $1.03 billion in liquidations across the market, with long positions suffering the most — over $911 million wiped out in a single day.
This intense volatility has weighed heavily on major altcoins, including Artificial Superintelligence Alliance (FET), which is down over 12%. However, despite the broader bearish sentiment, FET’s chart is now revealing a harmonic structure that could set the stage for a notable recovery if key support levels hold.
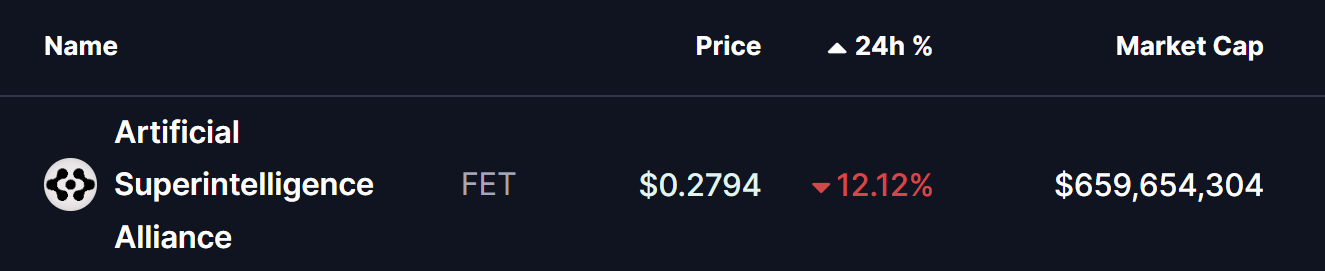 Source: Coinmarketcap
Harmonic Pattern Hints at Potential Upside
On the 4H chart, FET is currently forming a Bearish Cypher harmonic pattern. Although it carries a bearish label, the pattern typically involves a bullish CD leg rally before price reaches the Potential Reversal Zone (PRZ). This makes the ongoing formation an early sign of a potential upside move.
The pattern began at Point X near $0.4547, dropped to Point A, followed by a corrective bounce into Point B, and then extended sharply lower to Point C around $0.2711. Since reaching this low, FET has shown a slight recovery and is now hovering near the 100-moving average at $0.2776, indicating early attempts by buyers to regain control.
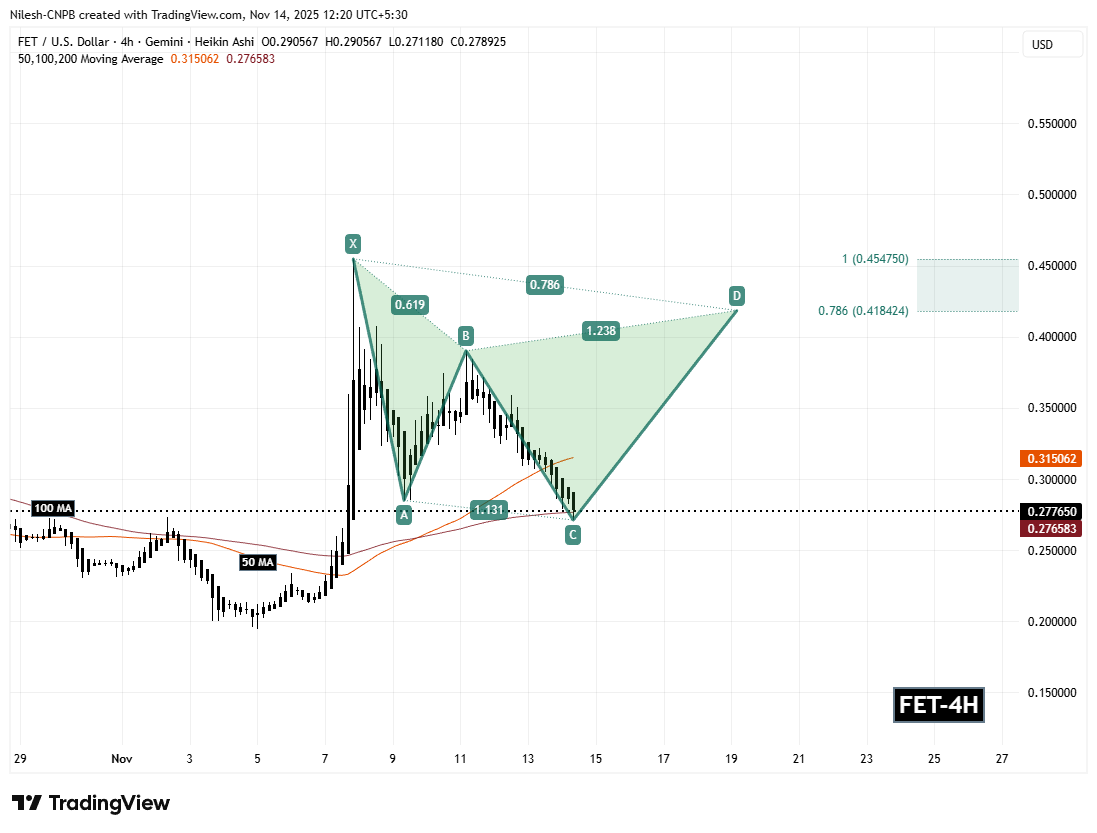 FET 4H Chart /Coinsprobe (Source: Tradingview)
A crucial element in this setup is the 50-moving average near $0.3150. Historically, this level has acted as a firm dynamic resistance. A strong breakout and 4H or daily close above it would signal a bullish shift in momentum, giving the CD leg the strength needed to extend higher.
What’s Next for FET?
If bulls continue to defend the C-point support near $0.2711 and manage to reclaim the 50 MA, FET may gain enough momentum to push toward the PRZ — a zone between $0.4182 (0.786 Fibonacci extension) and $0.4547 (1.0 extension). These levels represent the completion area of the cypher pattern and serve as the primary upside targets for this structure.
However, if FET loses its grip on the $0.2711 support, the harmonic pattern may weaken, potentially signaling the need for traders to reassess whether a deeper retracement is forming before any meaningful recovery can begin.