Compiled & Edited by: TechFlow

Podcast Source: 10x Research
Original Title: A Deep Dive into Bitcoin Bear Market On Chain and Market Indicators
Broadcast Date: November 13, 2025
Key Takeaways
About 10x Research
-
Predicted Bitcoin's bottom in October 2022 and expected Bitcoin to rise to $63,160 before the halving in March 2024 (halving adjusted to April, final price was $63,491).
-
In January 2023, we predicted Bitcoin would rise to $45,000 before Christmas, which was realized (final price was $43,613).
-
In September 2023, we pointed out that Bitcoin mining companies would be a key investment direction for 2024. Recently, in November 2023, we predicted Bitcoin would rise to $57,000 after ETF approval.
-
Predicted Bitcoin would rise to $70,000 in January 2024 and see a pullback near the high in March 2024.
This episode of the 10x Research podcast brings you an in-depth analysis, delving into the Bitcoin bear market:
What exactly do on-chain data and market signals tell us? Has Bitcoin already entered a bear market? How should traders respond now?
In the past three weeks, especially in our October 22 report, we have repeatedly emphasized some key signals. The plunge on October 10, the subsequent abnormal investor behavior, and Federal Reserve Chairman Powell's uncertain stance on a December rate cut are not isolated events but manifestations of the same macroeconomic backdrop.
With the SEC approving the Bitcoin ETF, regulation is no longer the main obstacle to a bull market. The real reason for the bull market stalling is that when market inflows weaken and profit-taking exceeds new demand, the market loses upward momentum.
This episode will analyze charts, capital flows, and various data points in detail to help you determine whether Bitcoin is currently in a bull or bear market. Even if Bitcoin is indeed in a bear market now, this bear market may not last long.
Highlights Summary
-
When Bitcoin's price falls below the 21-week moving average (EMA), the market enters a minor bear market.
-
If Bitcoin's price falls below the $110,000 - $112,000 range, we will maintain a bearish outlook; if the price breaks above this range, we may turn bullish.
-
In the past 30 days, long-term holders have sold 185,000 Bitcoins, worth about $20 billions. Long-term holders believe the market may decline further and thus choose to exit.
-
On-chain data also shows this may be a deeper market correction. The market now appears to have entered a bear phase dominated by selling. Selling may take various forms and could last longer.
-
We predict Bitcoin may rebound to $110,000 before falling again.
-
Historically, when Bitcoin's price falls below the true mean price, the market typically enters a deep bear phase. The current true mean price is about $82,000, which is an important dividing line between the end of a bull market and the start of a bear market. If the price falls below this level, the market may first test the key support at $93,000.
-
As long as Bitcoin's price is below $113,000, we will maintain a bearish market outlook.
-
Whether Bitcoin's price is below the 21-week moving average is an important indicator for judging market trends.
-
We expect the next bull market may start after the Federal Reserve's monetary policy shifts, which is one of the core factors we are closely watching.
Bitcoin Falls Below 21-Week EMA — The Key Bull Market Threshold
-
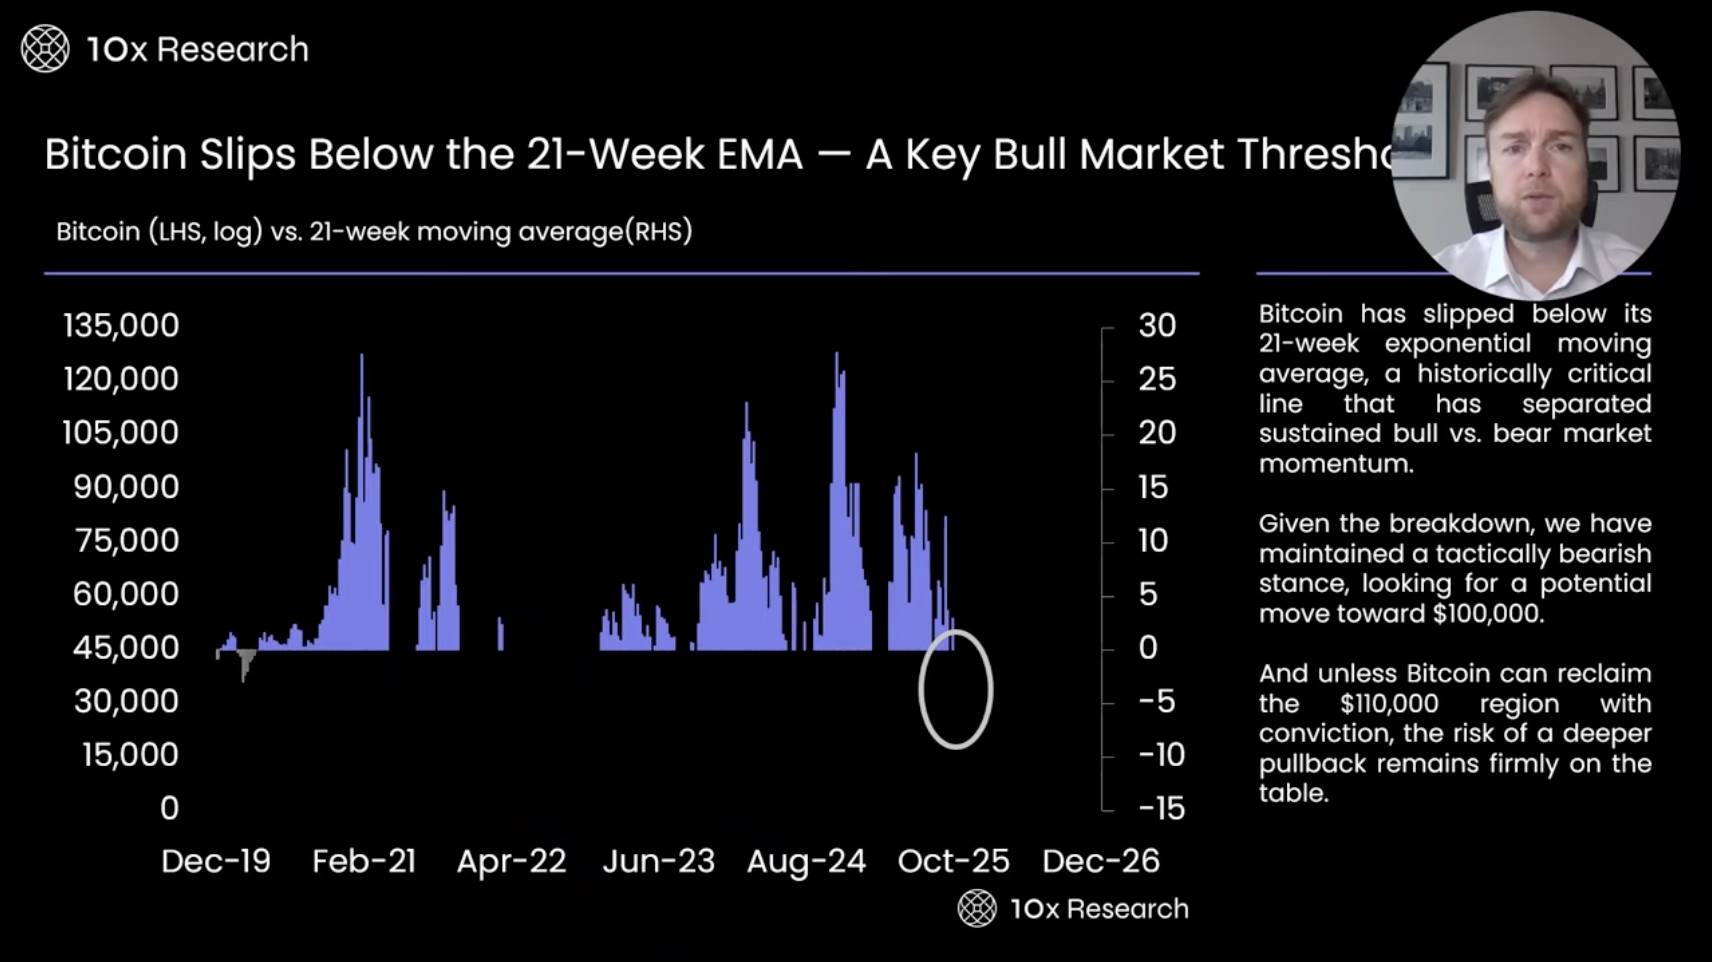
The indicator we are currently focusing on is the 21-week moving average (EMA). Typically, when Bitcoin's price falls below this indicator, the market enters a minor bear market. This indicator played a key role during the 2022 bull-to-bear transition, helping us avoid the heavy losses many suffered in the market.
-
Additionally, we observed the market correction in the summer of 2024 and the correction in the first quarter of this year. This indicator not only confirmed these corrections but also gave us early warnings. These adjustments usually range from 30% to 40%, which is very significant. Therefore, setting a clear reference line is crucial, and the current reference line is $110,000.
-
Multiple indicators point to Bitcoin's price being in the $110,000 to $112,000 range. If Bitcoin's price falls below this range, investors need to manage risk, reduce bullish positions, stay neutral, or even turn bearish.
-
The current EMA indicator shows that Bitcoin's price should fluctuate between $100,000 and $110,000, and the actual trend matches this prediction. This forces us to seriously consider: Is the current market entering an accelerated bear market phase?
Long-Term Holders Sell $20 Billion Worth of Bitcoin
-
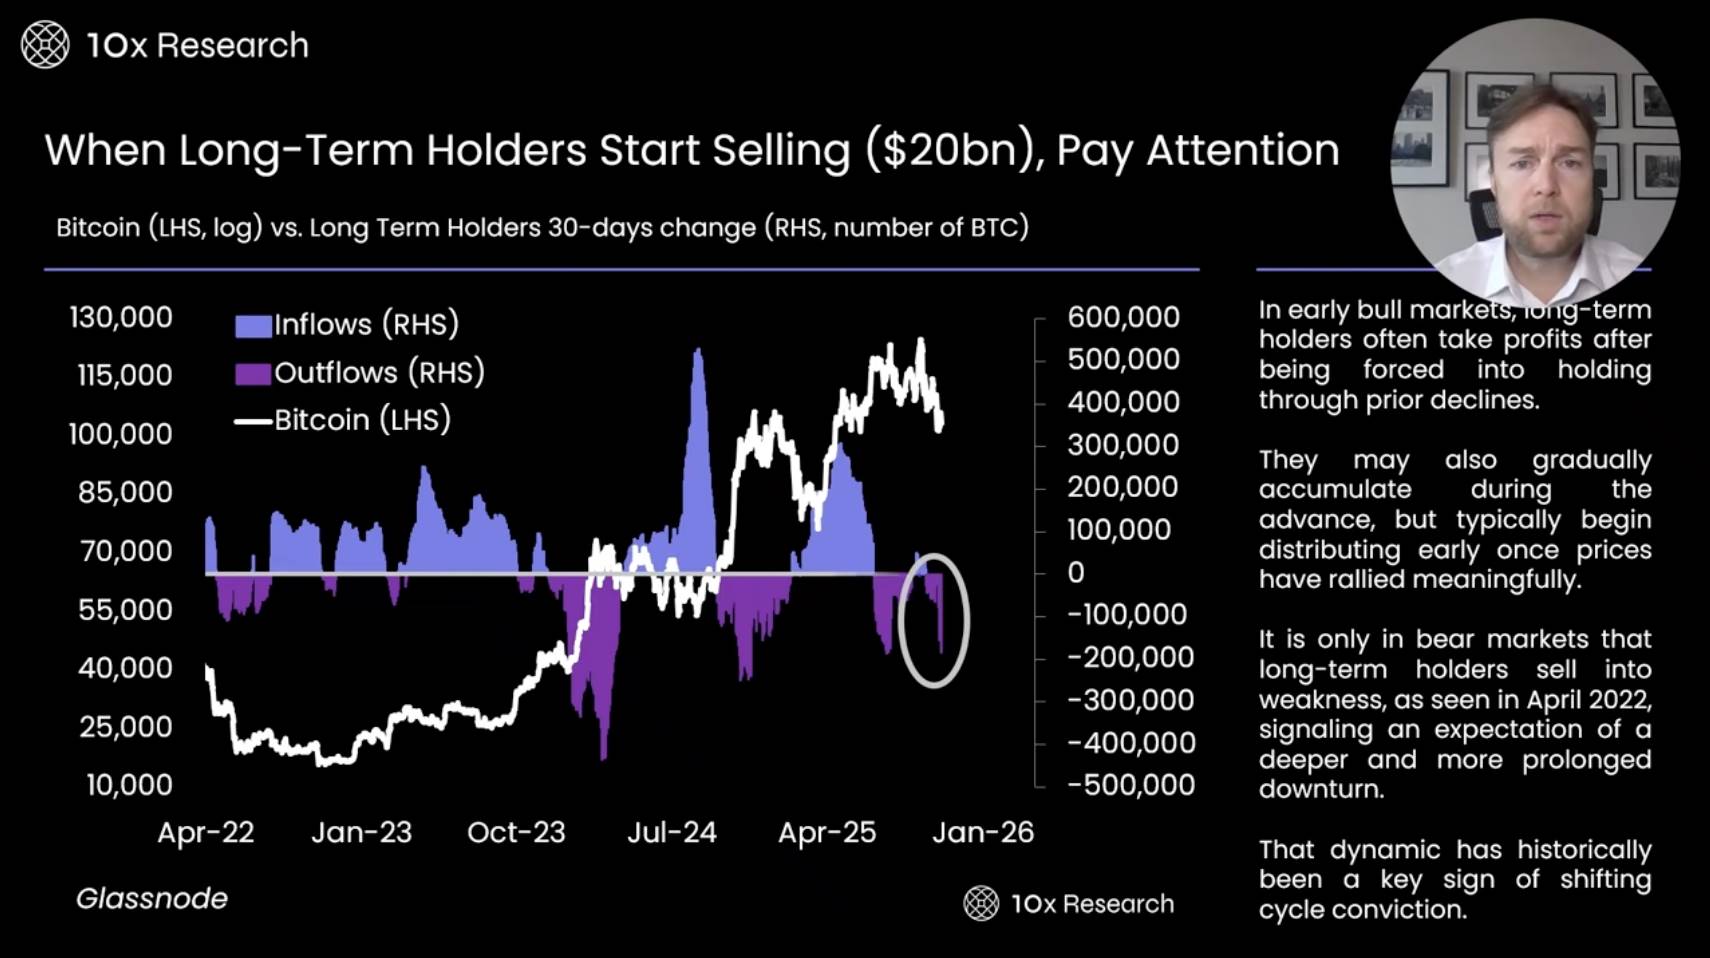
We need to pay special attention to the actions of long-term holders. In the past 30 days, long-term holders have sold 185,000 Bitcoins, worth about $20 billions. Typically, long-term holders tend to sell when prices rise and buy during consolidation, bottoms, or early rebounds. As the market rises further, they gradually exit and continue to reduce holdings at price peaks.
-
Looking back at April 2022, long-term holders sold off large amounts of Bitcoin, causing the price to fall from $40,000 to $20,000, and even briefly touch a low of $15,000. This phenomenon is noteworthy. In the past few weeks, Bitcoin's price has continued to decline, from $126,000 to the current $100,000 to $130,000 range. Long-term holders have not stopped selling Bitcoin.
-
This at least indicates that long-term holders believe the market may decline further and thus choose to exit. Whether their judgment is correct remains to be seen.
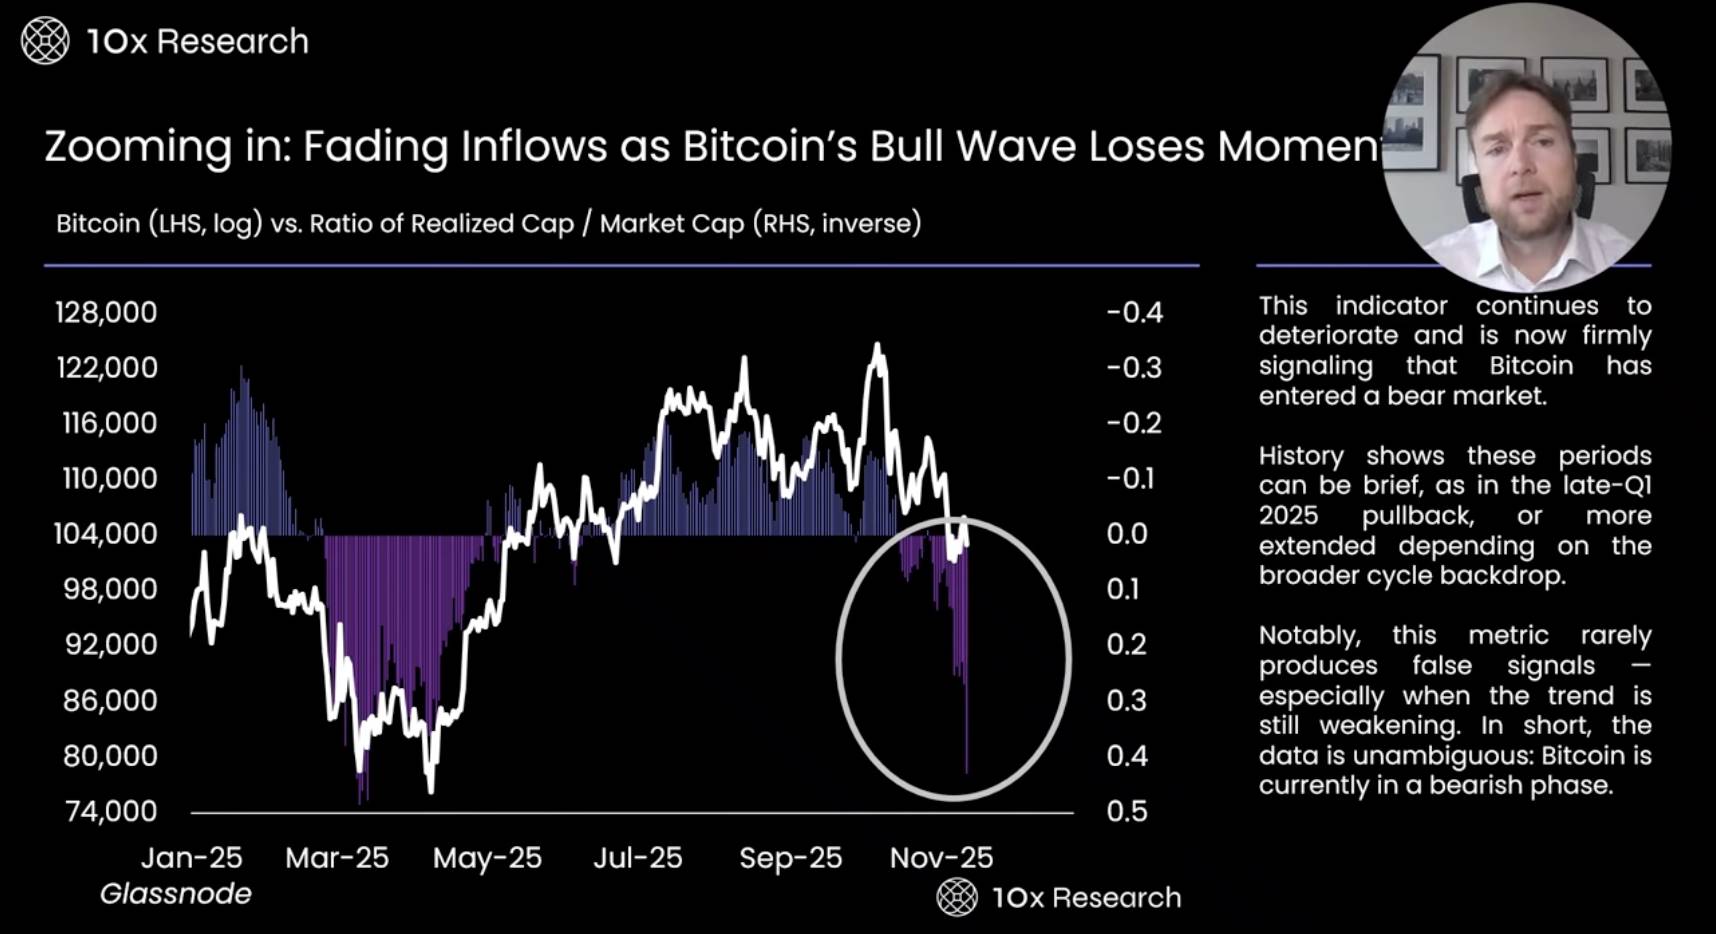
Realized Market Cap vs. Market Cap: A Reliable Signal for Bitcoin Cycle Shifts
-
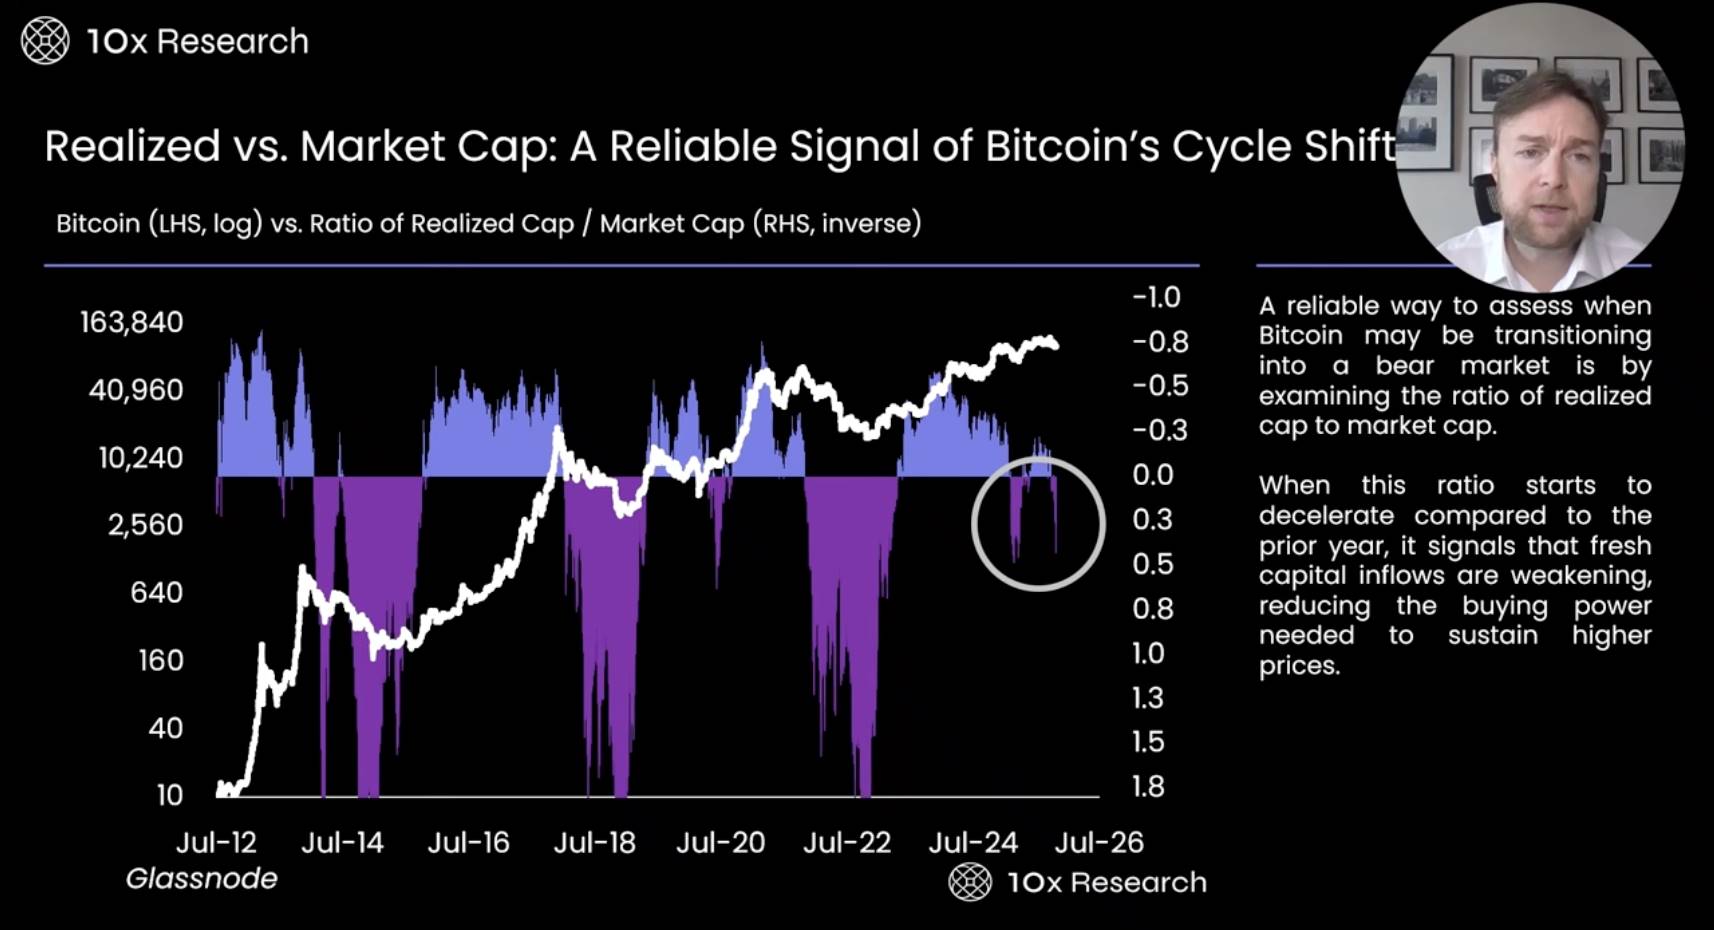
The ratio of realized market cap to market cap is a key indicator we often use. In previous bear markets, this indicator played an important role, not only successfully predicting large-scale bear markets but also accurately predicting similar minor bear markets.
-
When this indicator is negative, it usually means the market is in a correction phase, at which point investors are advised to exit, stay on the sidelines, or take a bearish approach. I believe the current market is in this phase and is worth close attention.
Bitcoin Bull Market Momentum Weakens, Capital Inflows Gradually Decrease
-
By zooming in further, we can more clearly see that the recent downward trend of this indicator is very similar to the worst period of the market in March this year. Although Bitcoin subsequently experienced a slight rebound, it then fell another 10% from the rebound level. Therefore, it is still difficult to conclude that the market has escaped trouble. In fact, whether $100,000 is the lowest point of this correction remains uncertain. According to this indicator's performance, the market may fall below $100,000 and go lower, as this indicator usually signals that a deeper correction is underway.
-
The market has already experienced several weeks of correction. But if we look back at the correction earlier this year, it was a 2-3 month adjustment, not just the roughly 3-week correction we see now.
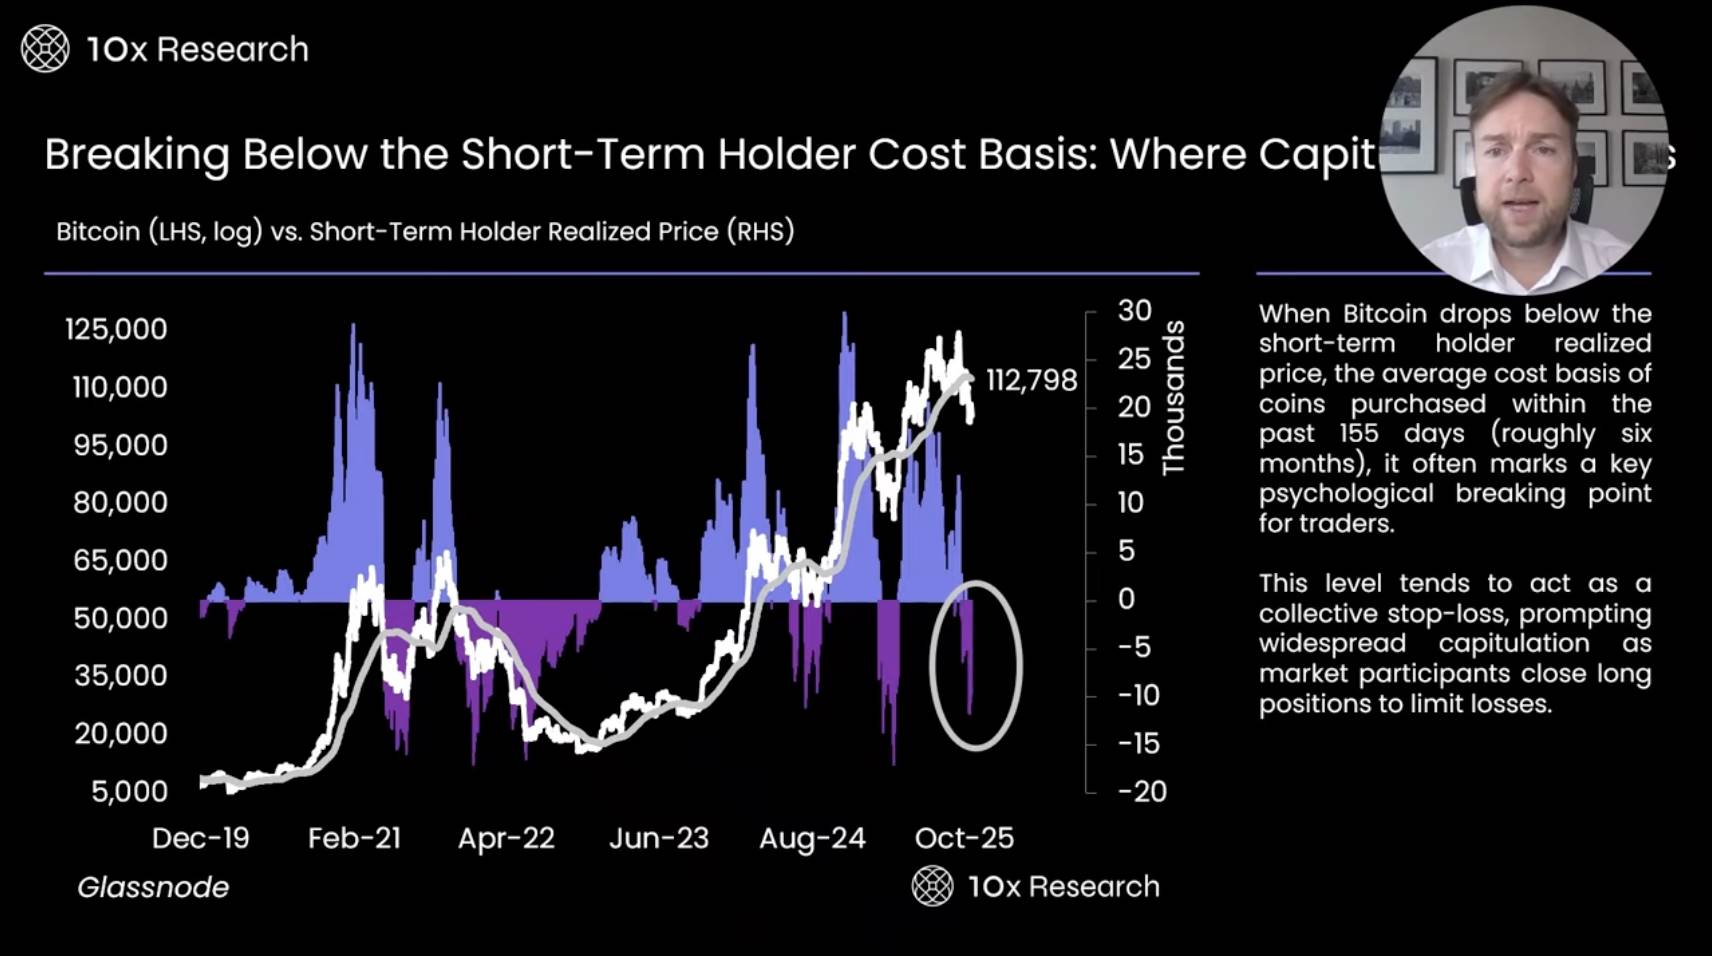
Short-Term Holder Cost Benchmark Broken: Capitulation or Just the Beginning
-
The realized price of short-term holders is a key indicator, currently at $112,798 (at the time of podcast recording), reflecting the average buy-in level of short-term holders over the past 155 days. When Bitcoin's price falls below this level, investors usually choose to stop losses, causing the market to fall further. This is mainly because short-term traders tend to buy in anticipation of price increases, but when the price falls below their buy-in price, they quickly sell their assets. We can see that when Bitcoin fell below $113,000, the price dropped further, triggering a large-scale forced liquidation event in October.
-
Additionally, on-chain data also shows this may be a deeper market correction. The market now appears to have entered a bear phase dominated by selling. Selling may take various forms and could last longer. Historically, when short-term holders are in a loss position, Bitcoin's price tends to fall further. Only when the price breaks above this level (ideally driven by a strong catalyst) can the market turn bullish. Otherwise, the market still faces significant downside risk. In this case, protecting capital is especially important. If we want to buy at lower prices, we must sell at higher levels.
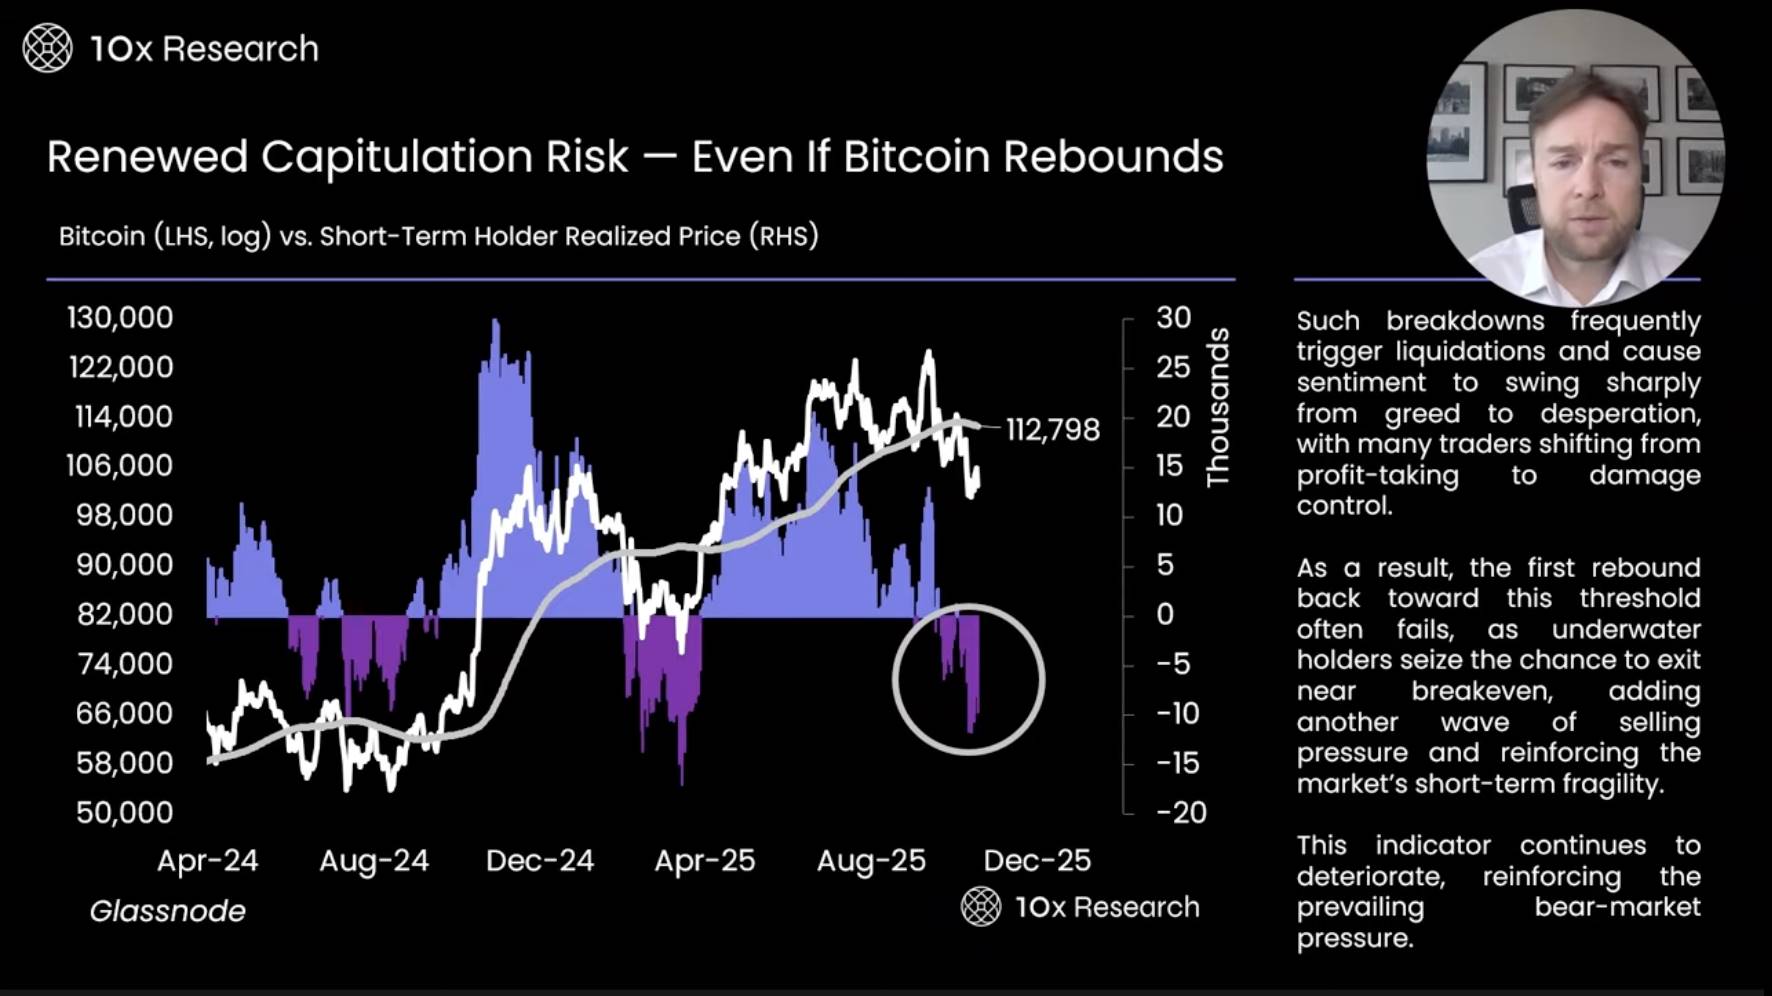
Capitulation Risk Reemerges — Even if Bitcoin Rebounds
-
In research reports over the past few weeks, we have analyzed Bitcoin's market trends from multiple perspectives. A deep dive reveals that during the correction in the first quarter of this year, relevant indicators became more negative, indicating that Bitcoin's rebound pattern is more like a W-shape rather than a traditional V-shaped rebound. A W-shaped rebound means the market price experiences two bottoms and rebounds over a longer period, rather than a quick recovery. Based on this, we predict Bitcoin may rebound to $110,000 before falling again.
-
However, from a trading perspective, this prediction may be too idealistic, as market trends are difficult to judge accurately. We cannot determine whether the price will rebound first and then fall, or directly enter a downtrend. Therefore, we believe that when Bitcoin's price is below $113,000, it is more reasonable to maintain a bearish stance. Unless the price breaks above this level, we are more inclined to focus on downside risk rather than trying to catch potential upside momentum.
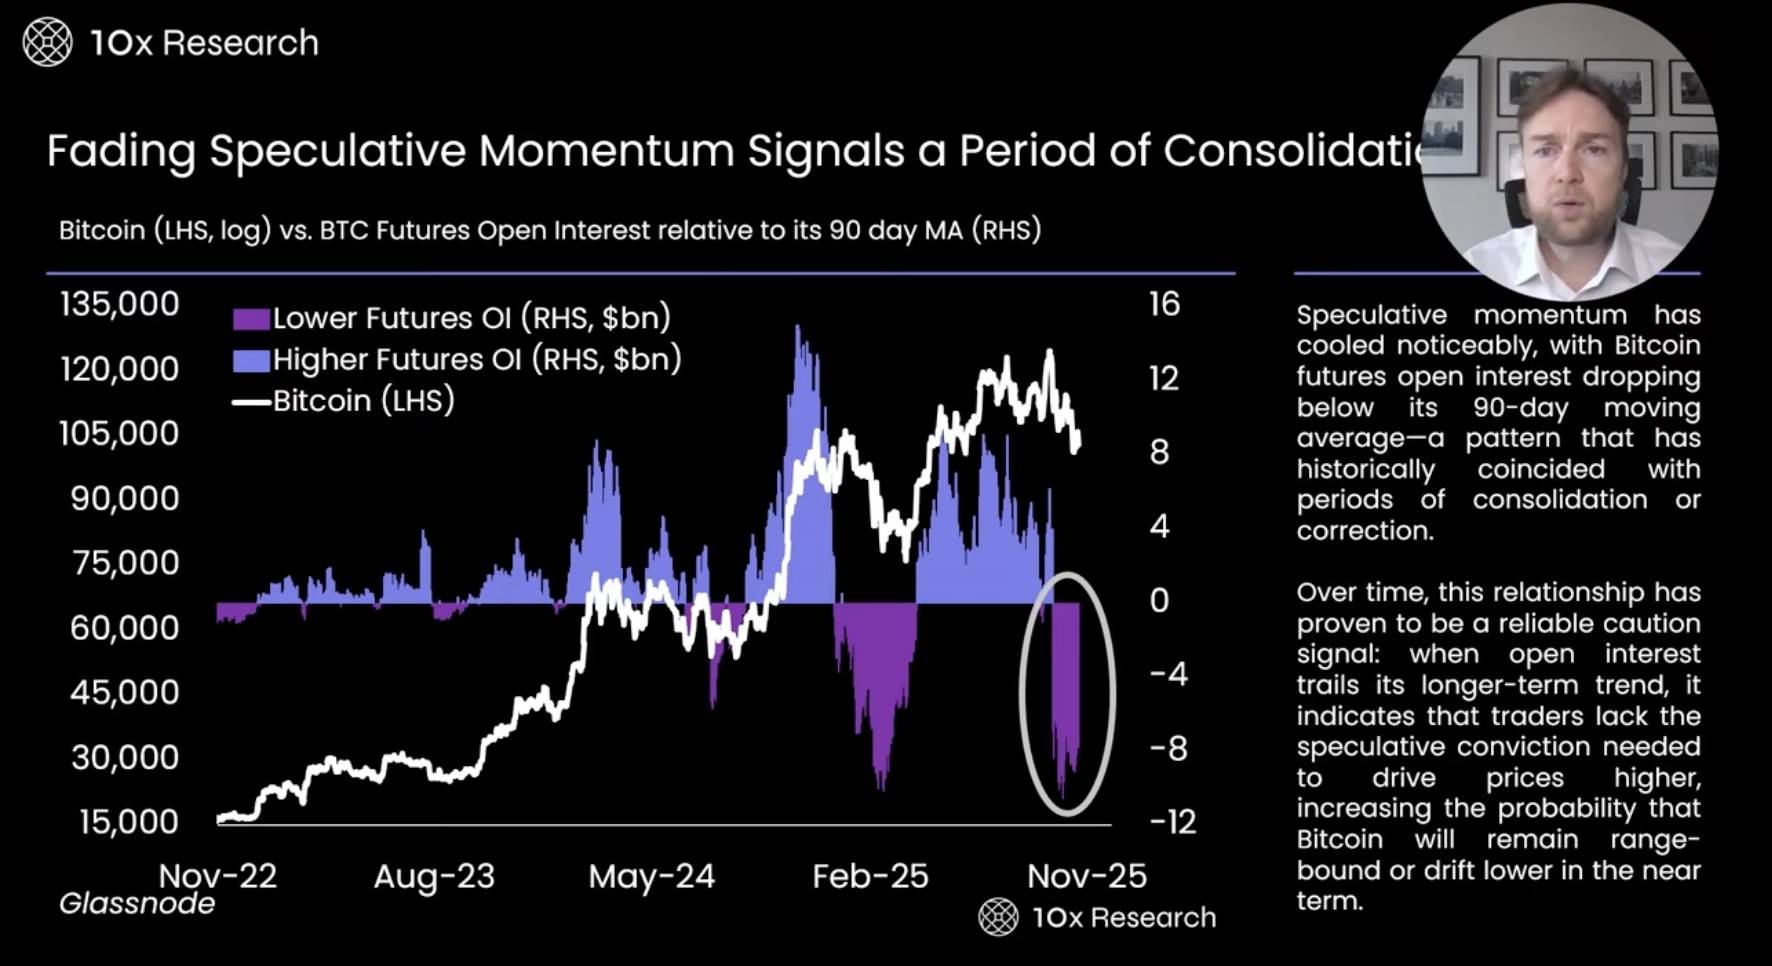
Speculative Momentum Weakens, May Signal Market Entering a Consolidation Phase
-
During the market correction on October 10, Bitcoin experienced a large-scale forced liquidation event. At that time, former U.S. President Trump threatened to impose a 100% tariff on China at the end of Friday's trading session, while U.S. stock index futures were about to close, and only the Bitcoin futures market remained open. It was at this moment that the Bitcoin futures market liquidated positions worth as much as $20 billions.
-
This shows that when the number of futures traders in the market decreases, it is difficult for Bitcoin's price to rebound. We may be experiencing a similar situation, as in previous market corrections, we also observed that once futures traders withdraw and unwind long positions, market rebounds become extremely difficult. This is one of the reasons we remain cautious. We closely monitor open interest, futures positions, and funding rates, none of which currently show bullish signals; instead, they indicate traders are taking very cautious risk management strategies.
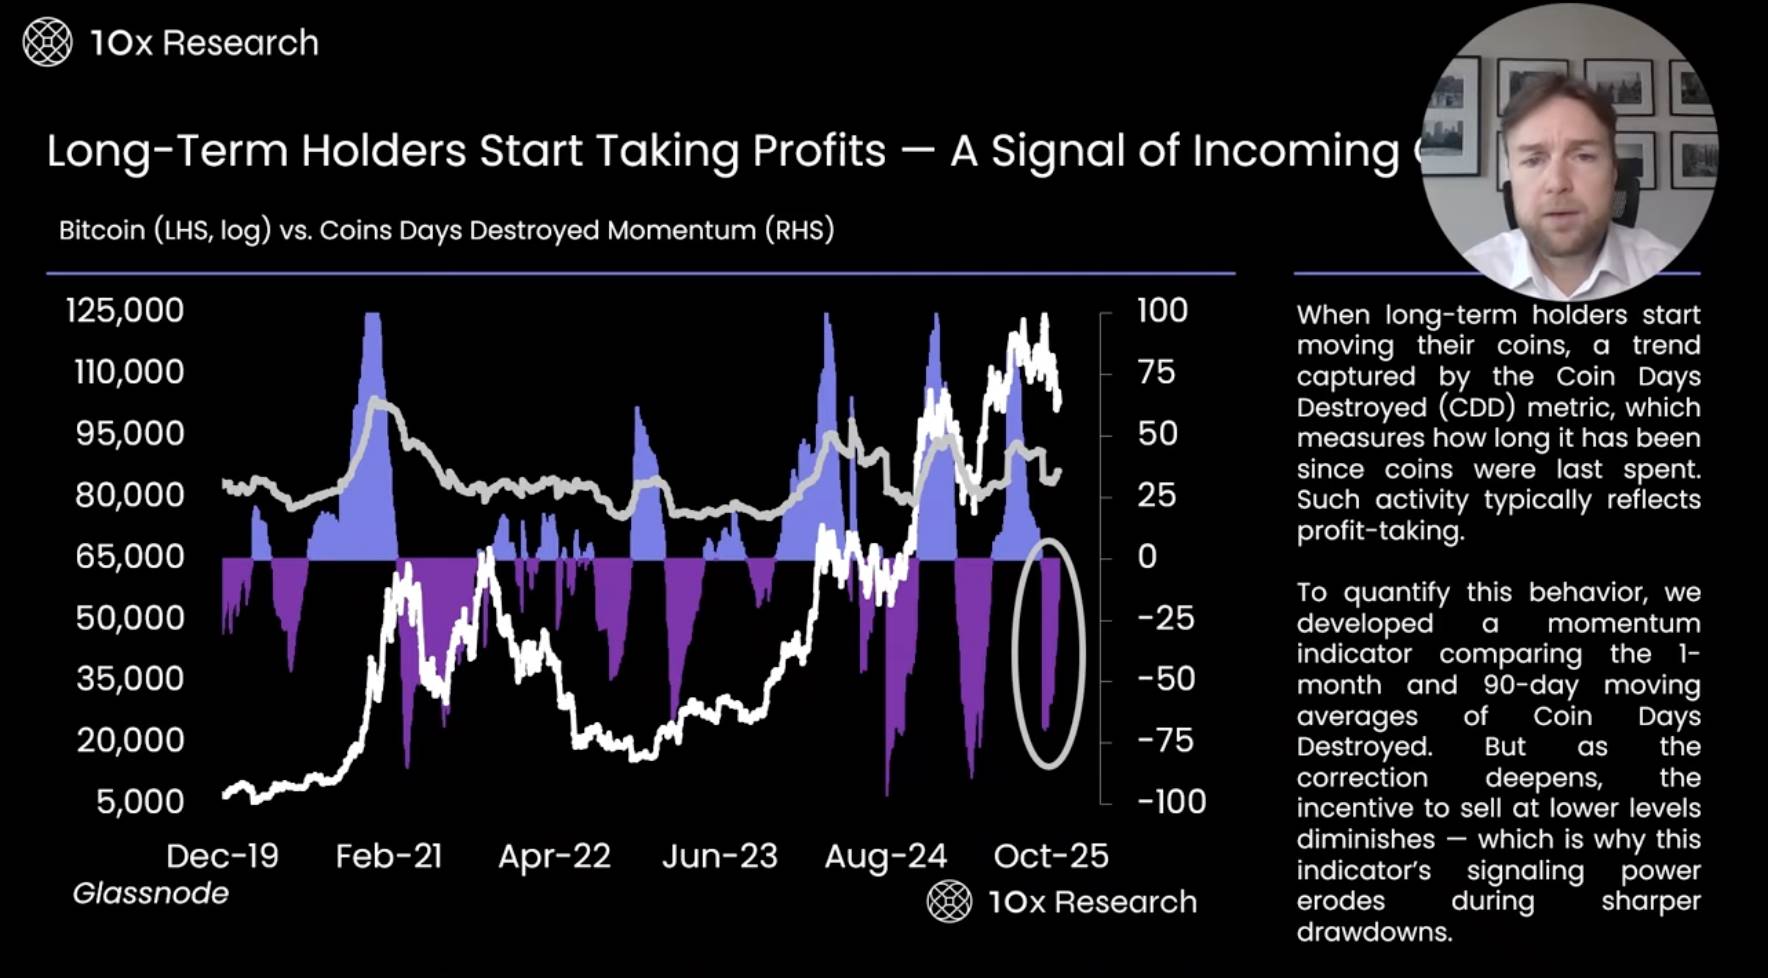
Long-Term Holders Start Taking Profits — May Signal a Coming Consolidation Period
-
Coin Days Destroyed is an indicator used to track seasoned investors who have held Bitcoin for a long time. Its principle is to monitor the number of coin days destroyed (i.e., the cumulative time of long-held Bitcoin being sold) to issue warning signals. When some long-term holders start selling Bitcoin, this indicator signals the market may be at risk.
-
However, as the bear market drags on, long-term holders usually choose to continue holding rather than selling at low prices. This weakens the predictive power of this indicator during bear markets. Even so, it can still provide some warning information. I believe this is also one of the important reasons for our cautious stance.
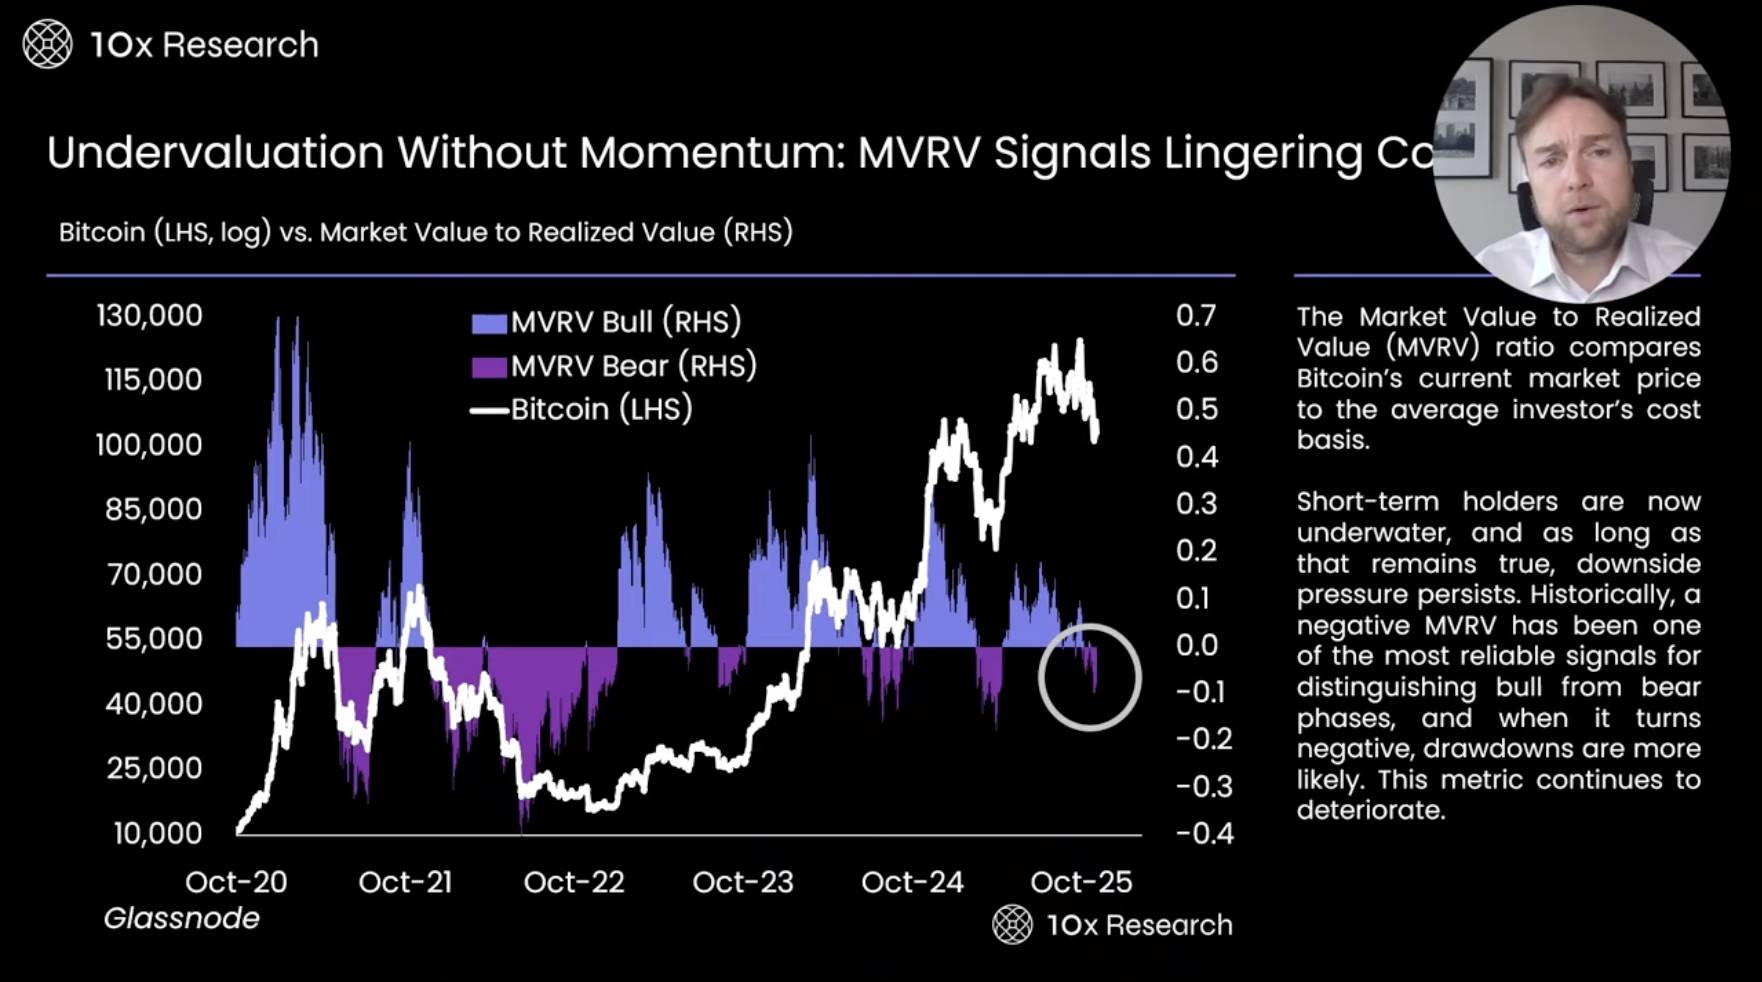
Low Valuation Without Momentum: MVRV Indicator Shows Consolidation May Continue
-
One of the most critical off-chain indicators is the Market Value to Realized Value (MVRV), which compares Bitcoin's current price to investors' average cost basis. Currently, this indicator has turned negative, mainly reflecting the situation of short-term holders who bought Bitcoin in the past 155 days, rather than the entire market.
-
This data shows that many investors are currently in a loss position. When investors are in a loss position, the market often undergoes a minor correction, or the adjustment may deepen further. This was particularly evident during the bear market from late 2021 to 2022. Additionally, it is worth noting that the current bull market momentum is weak. Compared to the bull wave at the end of October 2020, this time's market momentum and investor excitement are significantly lacking. This low-momentum performance makes the market more prone to rapid reversals, especially when investors realize they are in a loss position. For this reason, we have always been concerned that the current bull market may lose steam prematurely.
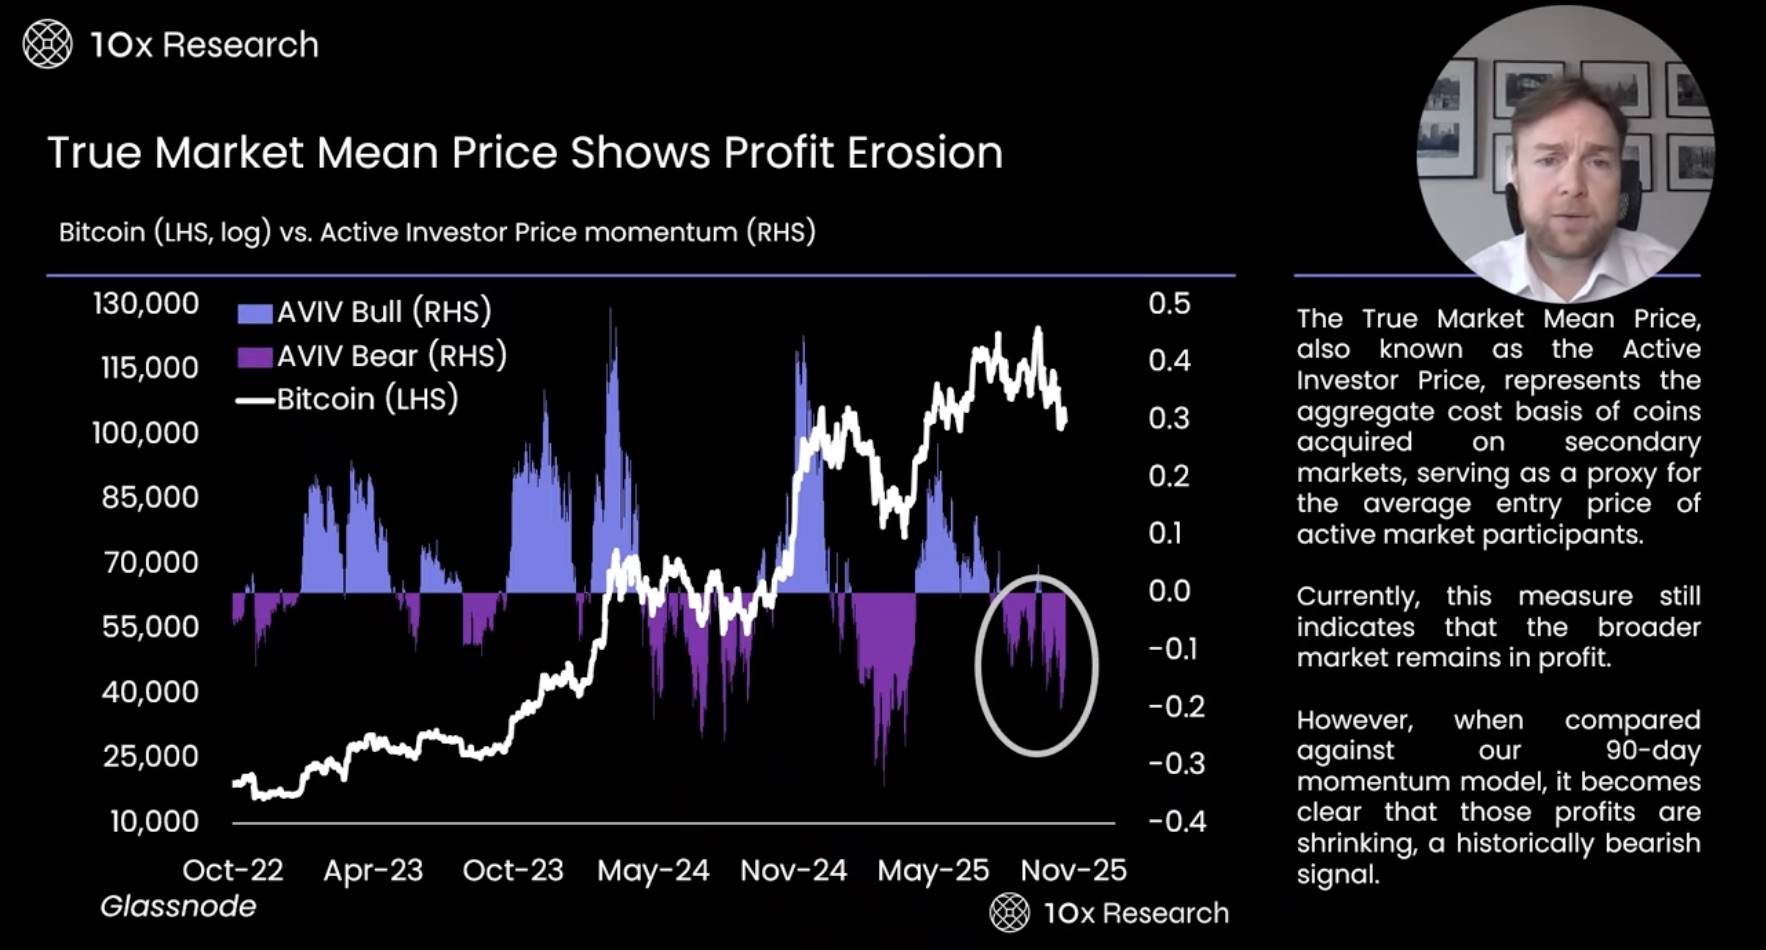
The True Mean Price Shows Investors' Profits Are Being Gradually Eroded
-
The True Market Mean Price is an important market indicator that reflects the overall buy-in cost of Bitcoin in the secondary market. It can be regarded as the average buy-in price of active investors and is used to analyze the cost pressure and behavioral tendencies of market participants. When investors face losses, they usually choose to sell or liquidate assets, a phenomenon that has frequently occurred at different stages of the market.
-
It is worth noting that since this summer, market activity has dropped significantly, and the overall trend has gradually weakened. This has put the market in a "critical point hovering" state. Looking back at last year's Trump election period, policy uncertainty triggered a wave of large-scale market activity, but after the tariff issue was resolved in April this year, the second wave of market activity weakened significantly. Therefore, the decline in market momentum has been faster than expected, and investor confidence has also been affected to some extent.
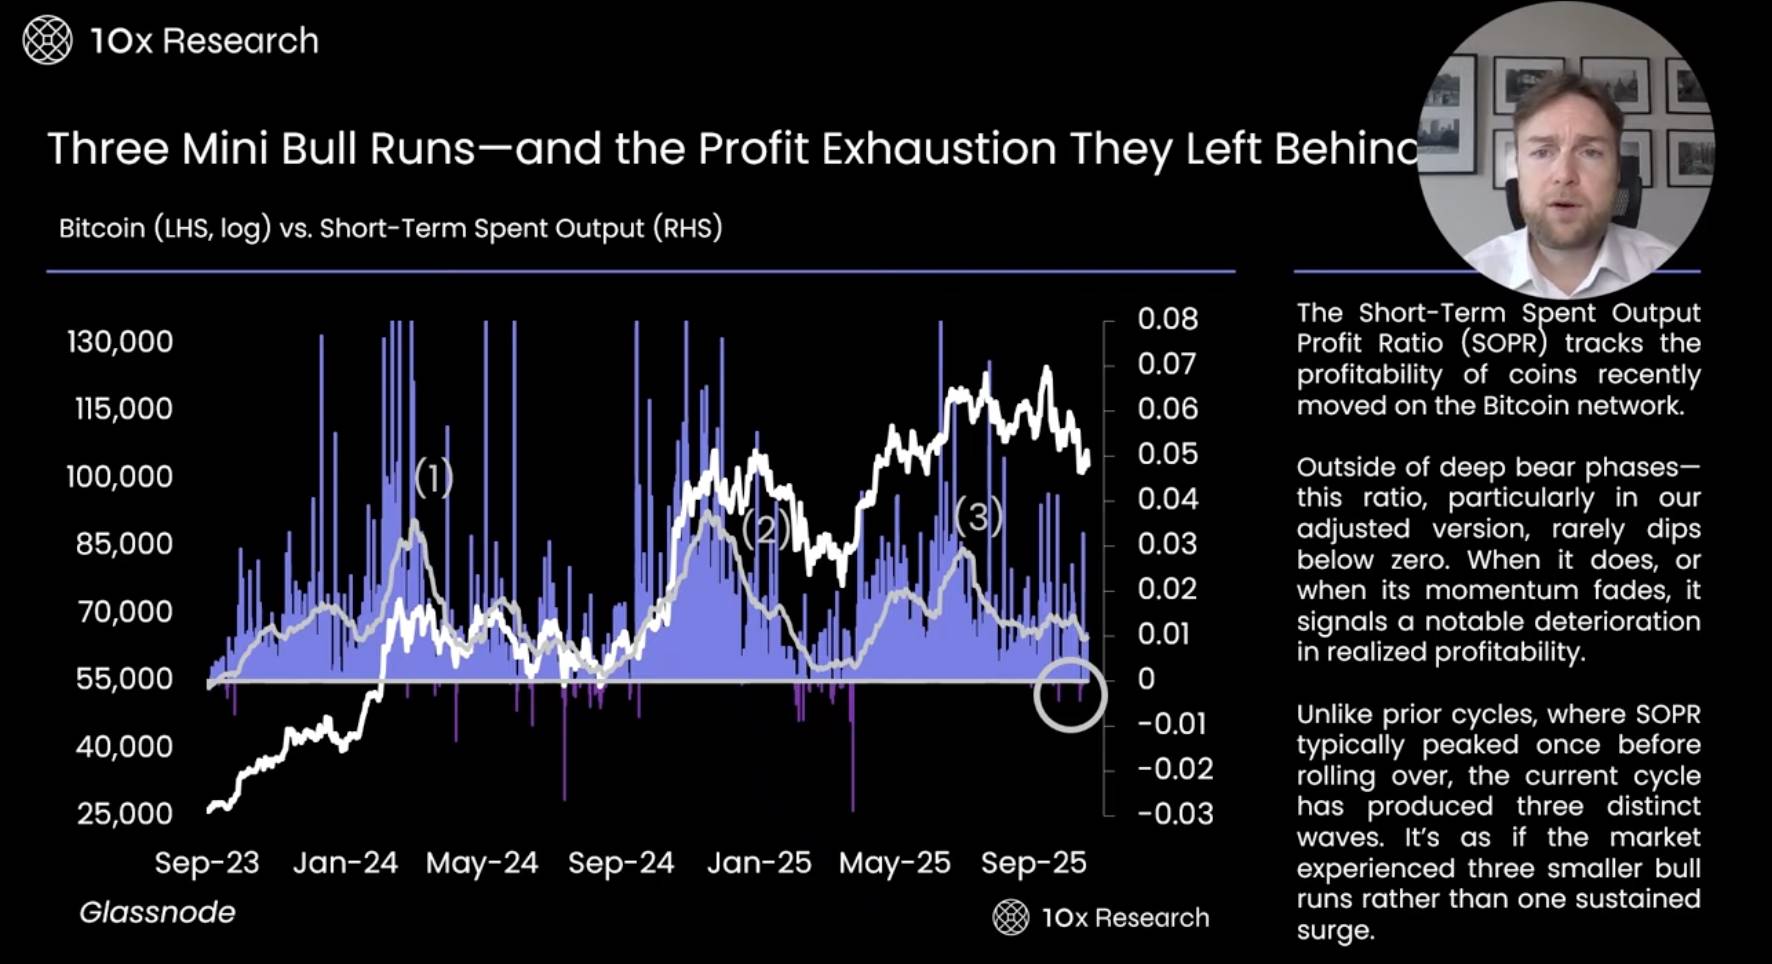
Three Minor Bull Markets — and the Signs of Profit Exhaustion They Left Behind
-
The Short Term Spend Output indicator is an important tool used to track whether coins circulating on the Bitcoin network recently are in profit. In the past two years, Bitcoin has experienced two to three brief bull markets, but these bull markets were short-lived and market momentum quickly faded. As the market entered a slump, we observed wave after wave of price rebounds, but the rebound amplitude gradually shrank, showing that the market's recovery strength is declining.
-
Historically, when the Short Term Spend Output indicator approaches zero, it usually means the market is near the bottom and is a good time to buy Bitcoin. However, this indicator has not yet reached zero, indicating that the market's short-term profitability has not been fully exhausted, so it may not be the best time to buy. Only when profitability approaches zero will the market bottom signal become more obvious. At this stage, staying on the sidelines or waiting for clearer market signals may be a more prudent strategy.
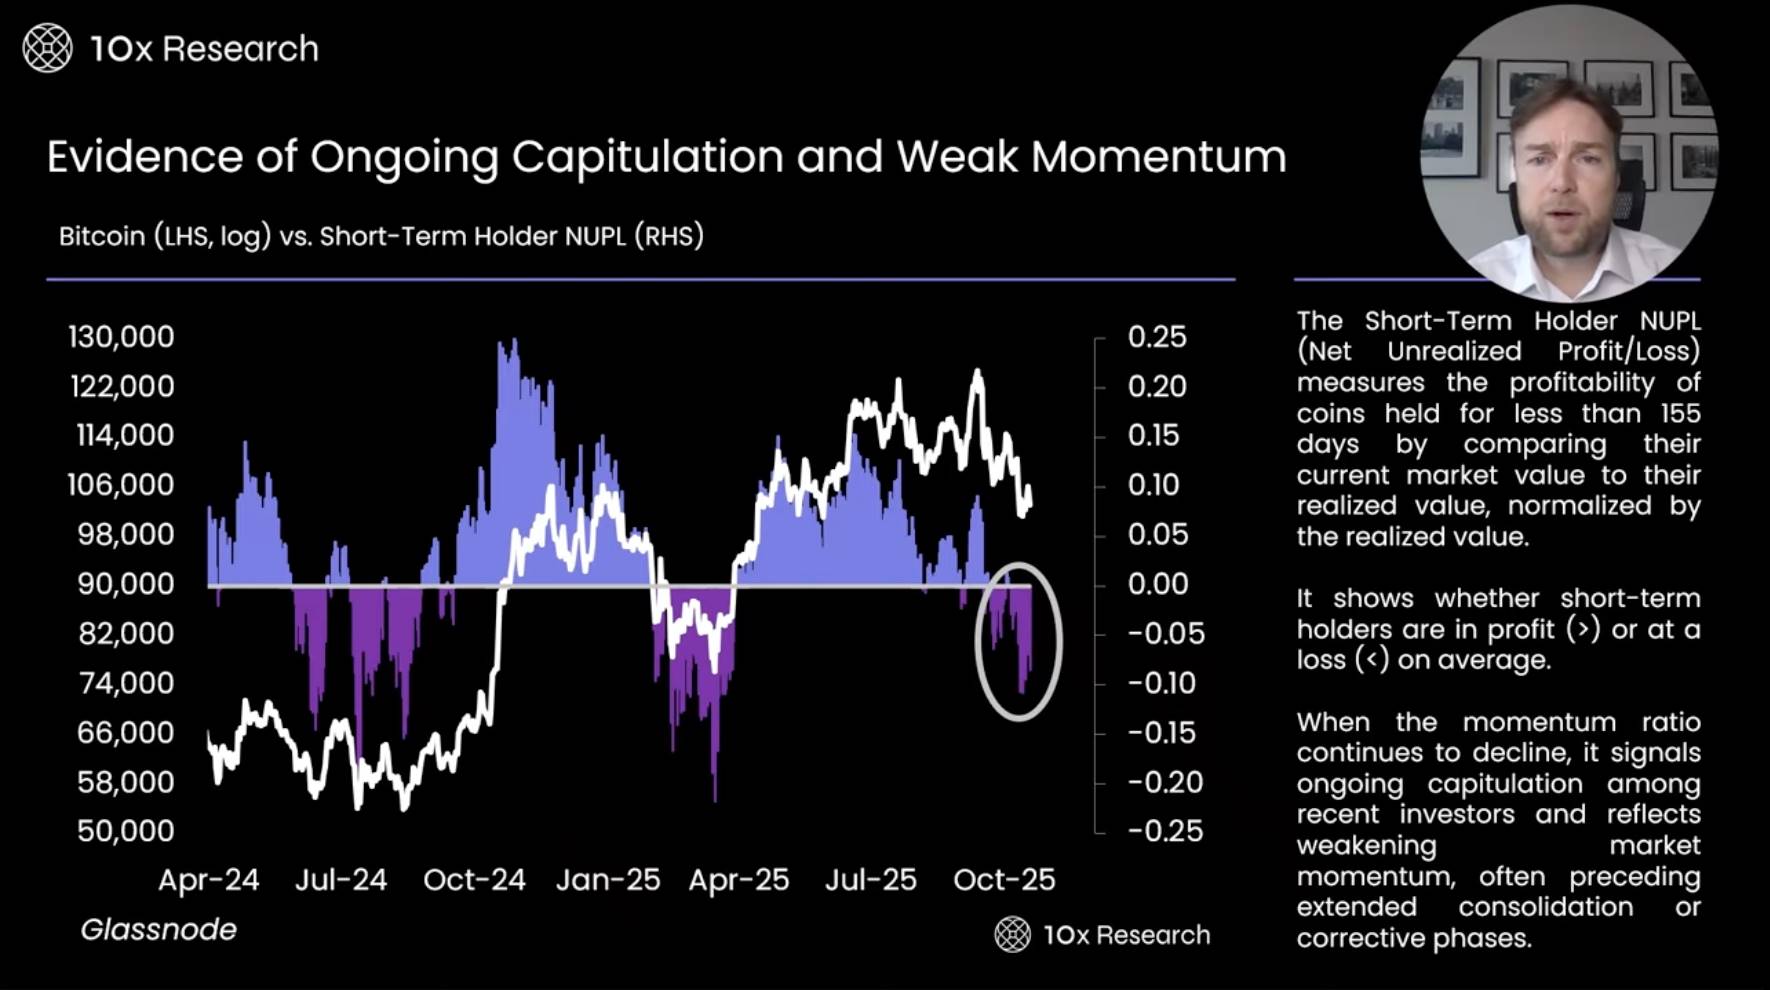
Evidence of Ongoing Capitulation and Weakening Momentum
-
Short Term Holder Net Unrealized Profit is an important indicator used to measure whether investors holding coins for less than 155 days are in profit. This indicator compares the current market value of coins with their realized value and normalizes it to reflect the investment performance of short-term holders. Current data shows that market momentum is weakening, and there are more signs of "capitulation" selling by investors, which is consistent with the current sluggish market state.
-
Comparing last summer's and this year's first quarter market corrections, we can see that the current correction may last longer and the decline may be greater. The current market price is still far from the historical high, so it may be difficult for Bitcoin to achieve a sustained rebound in the short term. The market may fluctuate within a narrow range of $110,000 to $100,000. In such an environment, investors can consider earning income by selling call options during rallies and deep out-of-the-money put options. Meanwhile, the next potential market catalyst is expected to appear after the Federal Open Market Committee (FOMC) meeting on December 10, when investors should closely monitor market dynamics.
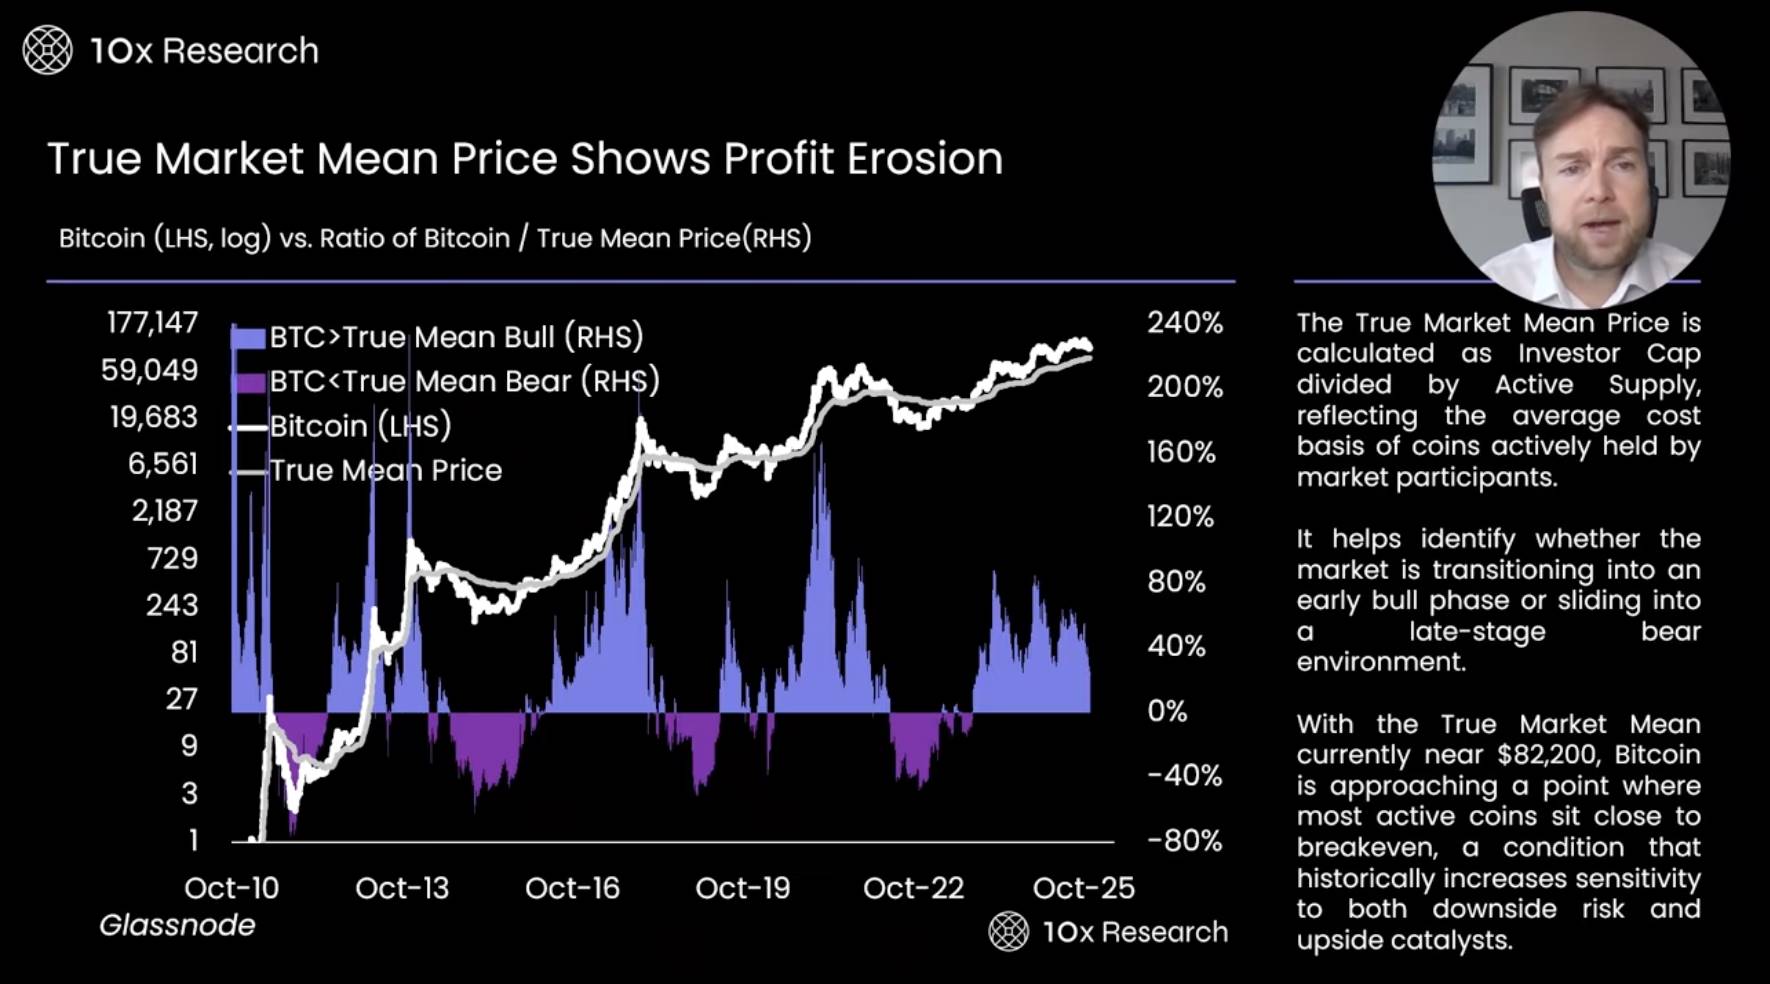
The True Market Mean Price Reveals Profit Erosion
-
On-chain indicators provide us with a more cautious market perspective. For example, the ratio of Bitcoin to the True Mean Price is calculated by dividing Investor Cap by active supply, used to measure the average cost of coins held by market participants. Current data shows that short-term holders' market momentum is gradually weakening, and most short-term investors are facing losses.
-
Overall, the average profitability level of the Bitcoin network is only 25%, which is close to MicroStrategy's Bitcoin purchase cost. Historically, when Bitcoin's price falls below the true mean price, the market typically enters a deep bear market phase. The current true mean price is about $82,000, which is an important dividing line between the end of the bull market and the start of a bear market. If the price falls below this level, the market may first test the key support at $93,000. Notably, during Trump's election, Bitcoin quickly rose from $68,000 to $93,000, with little trading volume in this range, so the market may experience an "air pocket" phenomenon, i.e., violent price swings and lack of stable support in this range. If this indicator is touched, it may trigger significant market volatility.
-
Currently, we are more concerned that Bitcoin's price may fall below $100,000. According to trend models and on-chain indicators, as long as Bitcoin's price is below $113,000, we will continue to maintain a bearish market outlook.
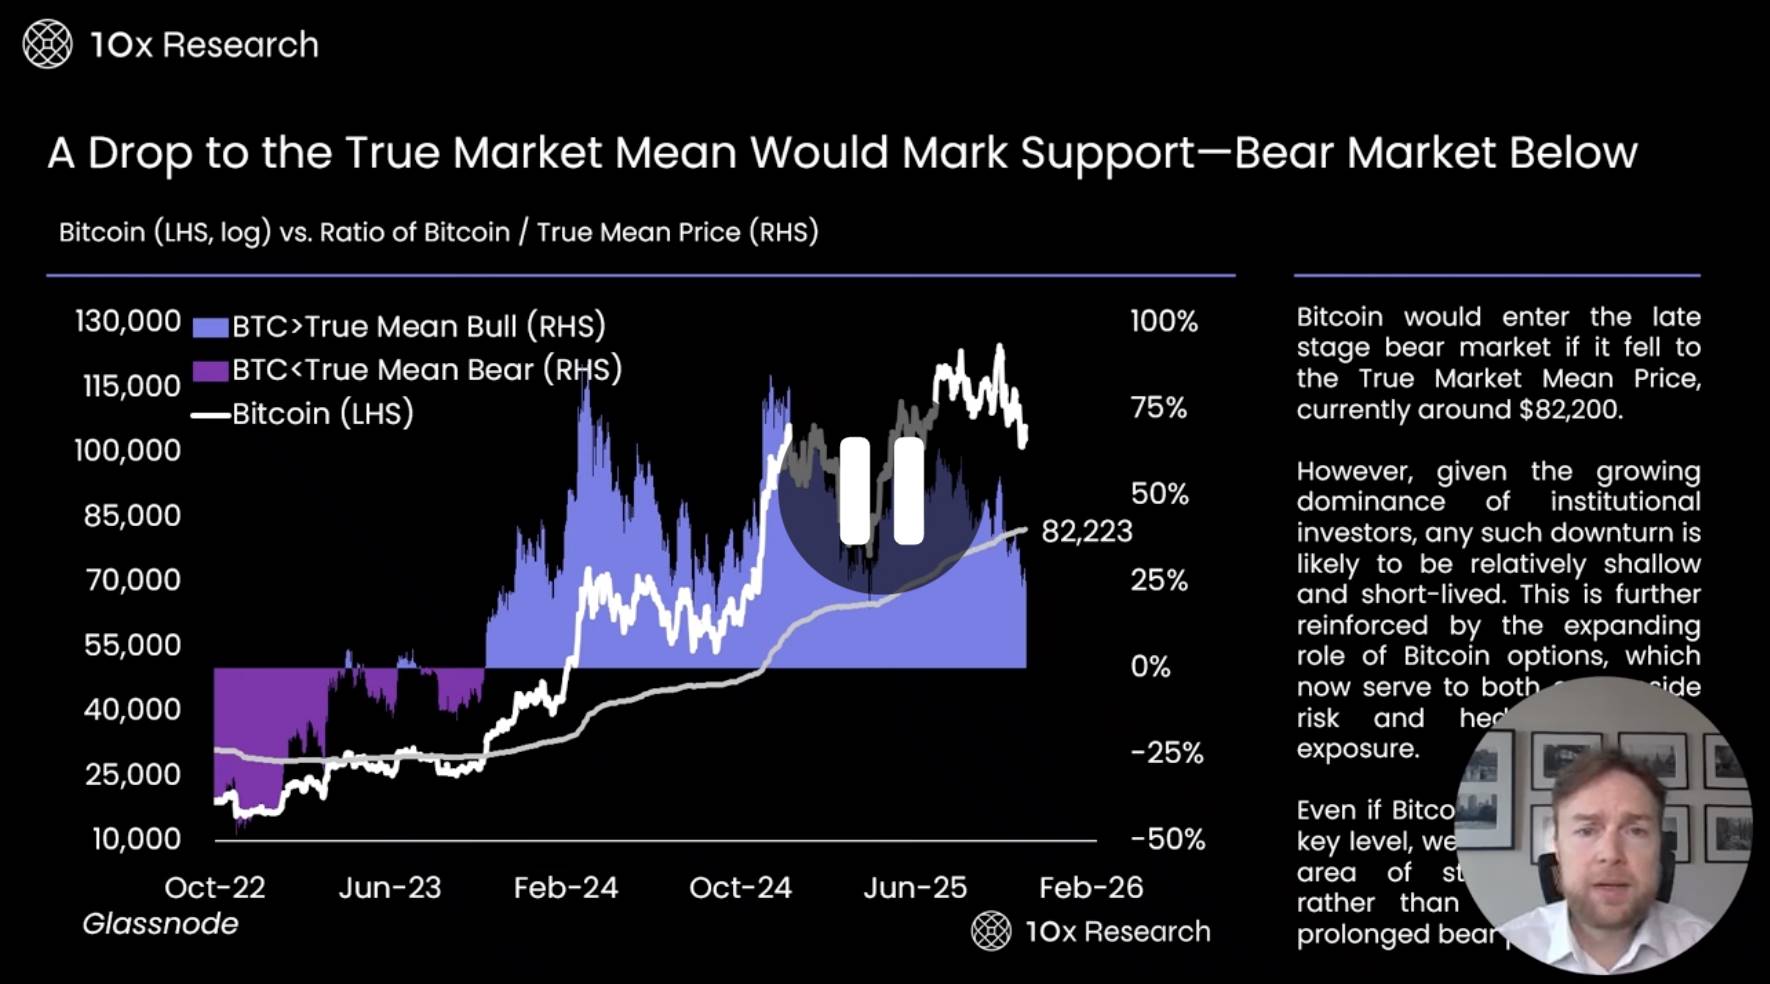
Falling to the True Market Mean Price Will Form Support — Bear Market May Unfold Below This Level
-
Data further shows that the average profitability of Bitcoin network investors has dropped sharply from 75% to 25%. This change is mainly due to active trading at the market top in recent months. Early investors (OGS) and veteran investors gradually sold Bitcoin to new investors, causing the market's average cost or true mean price to rise significantly. At the beginning of the year, the true mean price was about $50,000 to $60,000, but with the rapid increase in trading volume, this average price has climbed to a higher level.
-
A potential risk facing the current market is that a large number of new investors bought Bitcoin in the $100,000 to $126,000 range, making the market environment more fragile. These investors may be more likely to sell when prices fall. For example, when Bitcoin's price falls to $100,000, those who bought at $120,000 may quickly exit due to loss pressure, and this selling behavior may further exacerbate market instability. In addition, the average profitability level of long-term holders is only 25%, which is not high compared to the total market investment, indicating overall market confidence is relatively low.