
Will XRP Price Crash to 0.65?

XRP price is slipping again, and the mood across the market isn’t helping. With Nvidia, Walmart, Target, and Home Depot all reporting earnings this week—plus the return of US economic data after the historic 43-day government shutdown—risk sentiment is shaky. Traders are watching every candle with suspicion. In the middle of all this, XRP price has moved into a fragile zone, raising a tough question: is a drop to 0.65 even on the table?
XRP Price Prediction: Why the Market Mood Matters Right Now
Before jumping into the technicals, it’s worth understanding the backdrop. The shutdown halted key economic reports for more than a month, leaving investors moving blind. As the data pipeline reopens, volatility tends to spike.
Add to that:
- Nvidia’s earnings, which heavily influence risk appetite
- Major retailers reporting results that reflect real consumer strength
- FOMC minutes that may hint at the next interest-rate shift
- Ongoing weakness in housing and sentiment data
This kind of week can easily pressure altcoins. XRP feels that pressure more than most when momentum is already leaning down.
What the XRP Price Daily Chart Is Actually Showing
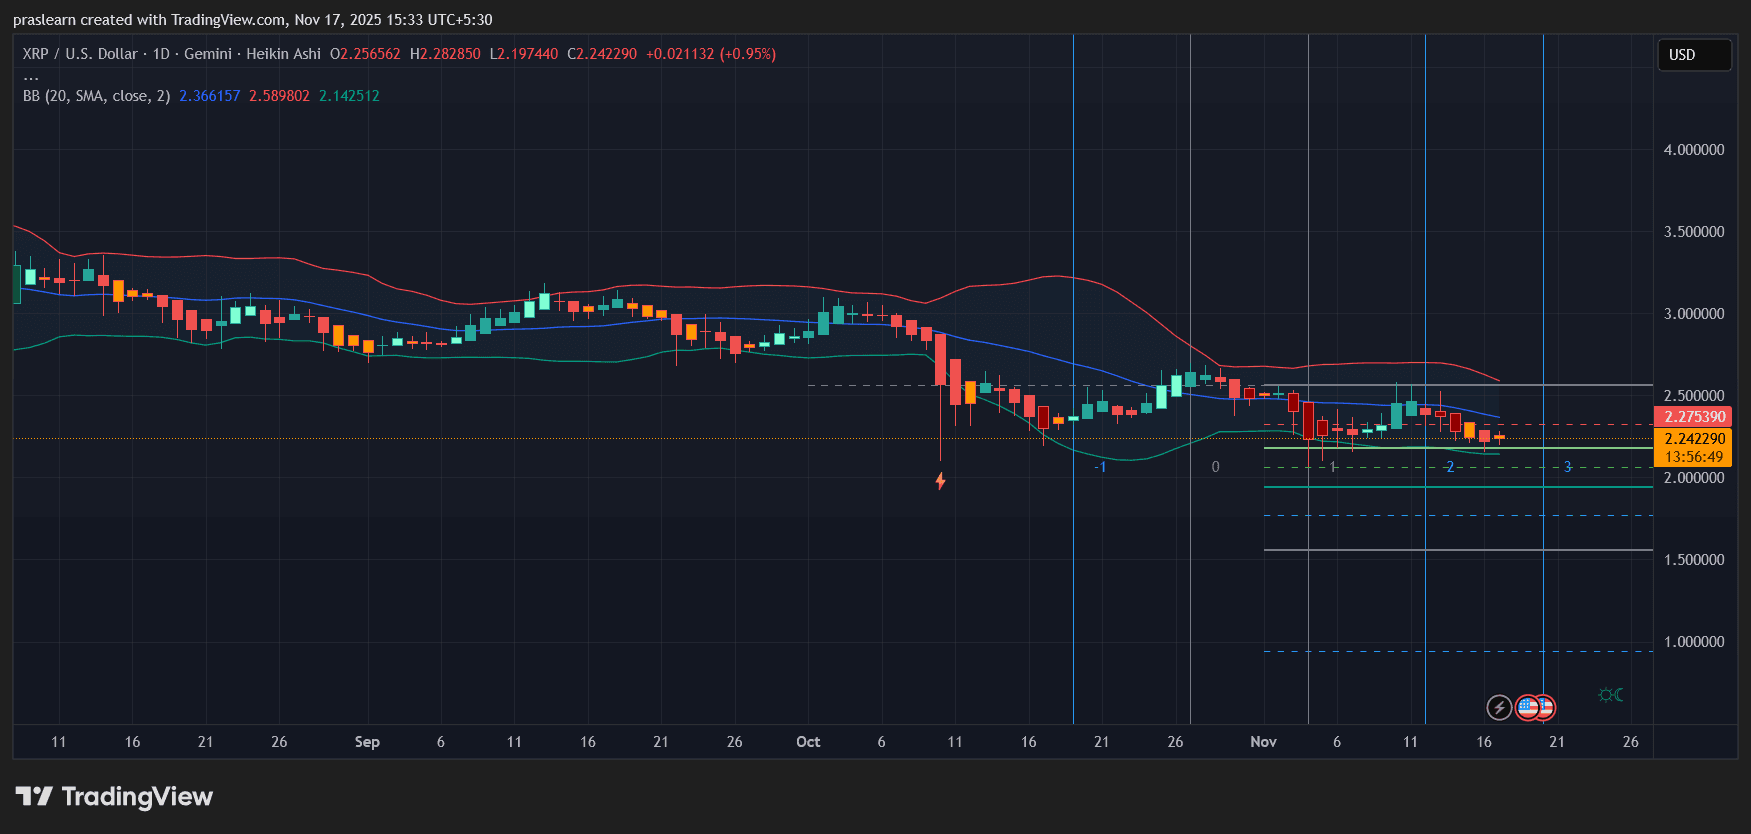
The daily candles tell a clear story: XRP is in a controlled downtrend, but not a freefall.
 XRP/USD Daily Chart- TradingView
1. Price Is Stuck Under the Mid-Bollinger Band
The mid-band has acted like a ceiling for nearly the entire month. Every attempt to reclaim it has failed, which shows sellers remain in control.
2. The Lower Bollinger Band Has Started to Slope Down
A downward-angled lower band often precedes another leg lower. It signals room for volatility to expand on the downside.
3. Repeated Taps of the 2.20–2.00 Support Zone
This region is being tested over and over without a convincing rebound. When support becomes a lounge chair instead of a trampoline, breakdowns happen.
4. Heikin Ashi Candles Are Softening
The candles are losing body size, with more flat-bottomed reds showing up. That’s a classic continuation signal in Heikin Ashi analysis. The chart is weak. But weak does not automatically mean catastrophic.
Is 0.65 a Realistic Scenario?
0.65 is nowhere near the current structure. To reach that level, XRP price would need to slice through several major supports that haven’t even been threatened on this timeframe.
For a move toward 0.65, you would need:
- A macro shock hitting all risk assets
- Bitcoin breaking its macro higher-low structure
- Altcoins entering a broad capitulation
- XRP-specific negative catalysts (legal, liquidity, exchange delistings, etc.)
- None of those conditions are present right now.
So while traders often float extreme targets in fear-heavy markets, the chart doesn’t justify a scenario that dramatic.
The More Likely Downside Path
Based on the current structure, the realistic progression looks closer to this:
- 2.20 – First support, already weakening
- 2.00 – Stronger shelf, but vulnerable if momentum stays negative
- 1.75–1.50 – Next demand zone if volatility widens
- 1.00–0.85 – Panic zone, possible only during market-wide distress
A crash straight into 0.65 would require an event far bigger than anything visible on the chart.
What Would Invalidate the Bearish Bias?
XRP needs to prove strength, not hint at it.
A real reversal begins only if:
• It closes a daily candle above the mid-Bollinger band: This would show buyers are finally taking back control.
• It forms two consecutive strong Heikin Ashi green candles: This isn’t happening yet.
• It reclaims the blue moving-average zone: That band has rejected price multiple times. A reclaim would shift the short-term trend.
Until these conditions appear, the bias stays bearish with controlled downside.
XRP Price Prediction: Will XRP Price Crash to 0.65?
The chart points to more downside, but not a collapse to 0.65. $XRP is weak, momentum is fading, and support is slowly eroding. But the structure does not support a multi-level crash that deep unless the entire crypto market enters a panic phase.
For now, the most realistic scenario is a drift toward the lower supports between 2.00 and 1.75, not a meltdown into the 0.60s.
If market conditions worsen after this week’s earnings and economic data flood back, those lower levels become more likely—but 0.65 remains a distant extreme, not an imminent threat.
Disclaimer: The content of this article solely reflects the author's opinion and does not represent the platform in any capacity. This article is not intended to serve as a reference for making investment decisions.
You may also like
Bitcoin News Today: "As ETFs Experience Rapid Growth, Metaplanet Remains Steadfast in the Battle for Bitcoin Leadership"
- Metaplanet holds 30,823 BTC, aiming for 210,000 by 2027 via preferred shares. - MicroStrategy's market value discounts raise debt concerns despite CEO's confidence. - ETF growth and institutional interest shift Bitcoin's perception as a long-term asset. - Japan's $2T assets drive Metaplanet's Bitcoin-backed fixed-income strategy.

Bitcoin News Today: Bitcoin’s Plunge Below $96K Sparks Concerns Over a Bear Market Resurgence Similar to 2024
- Bitcoin fell below $96,000, erasing 2025 gains and triggering $44M in liquidations as ETF outflows hit $870M. - Market cap dropped 5.4% to $3.36T, with Ethereum and XRP hitting multi-month lows amid weak demand. - Chain metrics show 815,000 BTC sold by long-term holders, while Bull Score Index collapsed to 20 from 80. - Technical indicators warn of further declines below $93,500, testing 2024 bear market lows if support breaks. - MicroStrategy added $835M BTC despite criticism, but fear/greed index hit 1
Bitcoin News Today: Bitcoin ETFs See $870M Outflow as Long-Term Holder Selling Drives Price Near $80k
- Bitcoin’s price nears $80,000 as fear indices hit 16, signaling panic-driven capitulation. - $870M ETF outflows and 815,000 BTC sold by LTHs accelerate downward pressure since October. - Key technical levels breached: 365-day SMA broken, 50-week SMA at risk, bear market risks rising. - Ethereum faces 200-day EMA resistance; whales accumulate ETH despite $3.66B in ETF outflows. - STHs near 12.79% losses, 6-12M holder cost basis at $94,000 may offer temporary support.

Bitcoin News Update: Bitcoin ETF Sees $1.5 Billion Withdrawals While Institutional Investors Increase Their Holdings
- BlackRock's IBIT ETF saw $1.5B net outflows over 10 days as investors reassess Bitcoin exposure amid volatility. - Harvard University boosted IBIT holdings to $442.8M, surpassing its combined stake in major tech firms, while diversifying into gold . - Institutional ownership in IBIT rose to 29% QoQ, with UAE entities and sovereign wealth funds among key holders, signaling crypto's growing institutional acceptance. - KuCoin expanded institutional services as ETF outflows highlight market recalibration, wi