DOGE Tests a 0.165 Zone as 3 Straight Corrections Shape a Rebound Attempt

- DOGE moves through a long slide with repeated drops while the chart shows a clean attempt to build strength near the lower band.
- The pair holds a narrow path around 0.15 as buyers try to lift price away from the base that formed after several swift declines.
- A break above 0.165 may support stronger movement as the recent pattern shows a steady shift after deep corrective waves.
DOGE trades near a tight level after several fast corrections pulled the pair away from the recent 0.18311 high. The price now holds close to 0.153 as the market watches for signs of a rebound that may gain strength only if DOGE pushes above the nearby 0.165 zone. The chart shows a clear pattern of repeated drops mixed with short pauses as the market slowly tries to reset momentum.
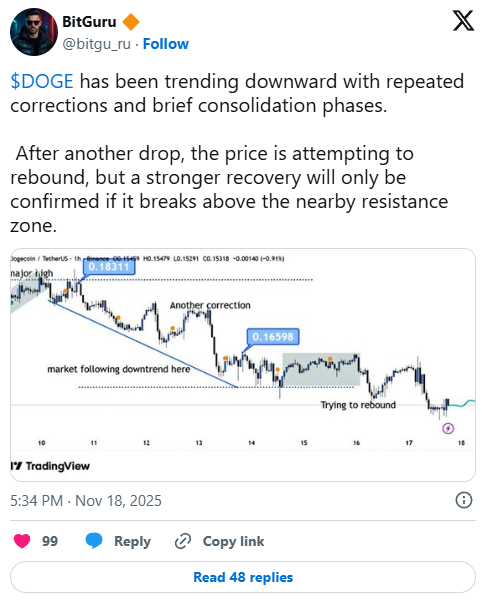
A Clear Downtrend Follows the 0.18311 High
DOGE moved sharply lower after touching the 0.18311 level. The chart shows a strong decline that formed a clean downward line. This move created the first corrective wave that shaped the next direction.
The slide continued as DOGE produced another drop near mid-week. Price moved lower through each stage and formed a new swing low. The move stayed aligned with the downward guide that started near the major high.
The structure shows several minor pauses. Each pause formed a short sideways block before another drop followed. These blocks show attempts at stability but none held long enough to reverse the overall structure.
A Tight Range Forms Near 0.16598 After Several Corrections
DOGE created a mild push upward after the first slide but failed to hold above the middle band. The chart shows a notable touch near 0.16598 before the price moved lower again. This level acted as a short resistance and shaped a key reference point.
The pair then entered a flat zone that formed a shaded area around the mid-range. Price moved sideways inside this zone for a long stretch. This sideways path shows an early attempt to slow the decline.
The structure ended when DOGE broke below the sideways band. A new dip followed and pushed the price toward the 0.153 region. This area became the latest support after the market faced several strong downward pushes.
Rebound Attempts Start as Traders Watch the 0.165 Area
DOGE now trades in a narrow band with small candles forming near the lower edge. Several attempts to lift the price appear on the right side of the chart. These attempts show early signs of pressure building for a possible rebound.
The main question now guides the trader’s focus. Can Dogecoin clear the 0.165 zone with stable strength after several deep corrective stages?
This zone forms a clear barrier that decides the next short path. A break above this area would signal a shift from decline to early recovery.
DOGE also shows a curved projection on the right side of the chart. This projection outlines a possible move upward if buyers maintain enough pressure. The projection remains hypothetical but aligns with the support seen near the final dip.
The hourly structure shows that DOGE must avoid slipping under the 0.153 region. This region formed after a fast drop and now holds the current base. A push above 0.165 may open the next path toward mid-range levels that held earlier in the chart.
The chart also shows that each past pause formed before another wave lower. This makes the coming days important as traders observe if the present pause will hold. DOGE continues to move inside a controlled area that shapes a crucial stage for short-term direction.
Disclaimer: The content of this article solely reflects the author's opinion and does not represent the platform in any capacity. This article is not intended to serve as a reference for making investment decisions.
You may also like
Stablecoin Surge Compels Basel to Address Regulatory Inflexibility
- Global regulators, led by the Basel Committee, face pressure to revise strict 1,250% capital requirements for stablecoins as their role in institutional finance expands. - The U.S. Fed, Bank of England, and EU reject current rules, citing impracticality, while stablecoins like USDT/USDC now underpin regulated crypto derivatives and yield products. - Basel chair Erik Thedéen acknowledges the need for a "different approach" to risk-weighting stablecoins, which now enable institutional access to crypto mark

Markets Trapped Between Fear and Optimism for the Future
- U.S. markets face volatility as delayed September NFP data creates uncertainty over Fed rate-cut timing, with crypto and equities reacting sharply. - Bitcoin erased 2025 gains amid waning sentiment and liquidity strains, while AI stocks like Nvidia falter on profitability concerns. - Gold struggles near $4,080 as hawkish Fed signals boost the dollar, contrasting with Kraken's $20B IPO optimism in crypto diversification. - Upcoming NFP report and Fed minutes could determine market direction, balancing sho

Zcash (ZEC) Price Rally: Renewed Interest in Privacy Coins Fueled by Institutional Engagement and Clearer Regulations
- Zcash (ZEC) surged 10.72% to $683.14 on Nov 15, 2025, driven by institutional adoption and regulatory clarity. - Major investors like Cypherpunk ($146M) and Winklevoss ($58.88M) boosted ZEC's market cap to $7.2B, surpassing Monero. - U.S. Clarity/Genius Acts legitimized Zcash's optional-privacy model, distinguishing it from untraceable coins amid regulatory scrutiny. - Price volatility and technical indicators suggest potential for $875 if institutional demand and regulatory support persist. - Zcash's st
Ethereum Updates Today: Can Bulls Defend the $2,850 Level or Will Bears Take Over?
- Ethereum's $3,000 price tests $2,800–$2,950 support zone amid bullish wedge patterns and bearish breakdown risks. - Analysts split: Erik warns $2,850 break could trigger $800–$1,000 drop, while Matt Hughes calls $2,870 pullback a normal correction. - Technical indicators show mixed signals - ETH above 100-day EMA but below 50-day EMA, with Bollinger Bands framing $2,850–$3,150 key levels. - On-chain data suggests potential "liquidity reset" could precede bullish expansion, but delayed recovery risks prol