The $3,170 Ceiling? Here’s Why Every Ethereum Price Bounce Keeps Failing

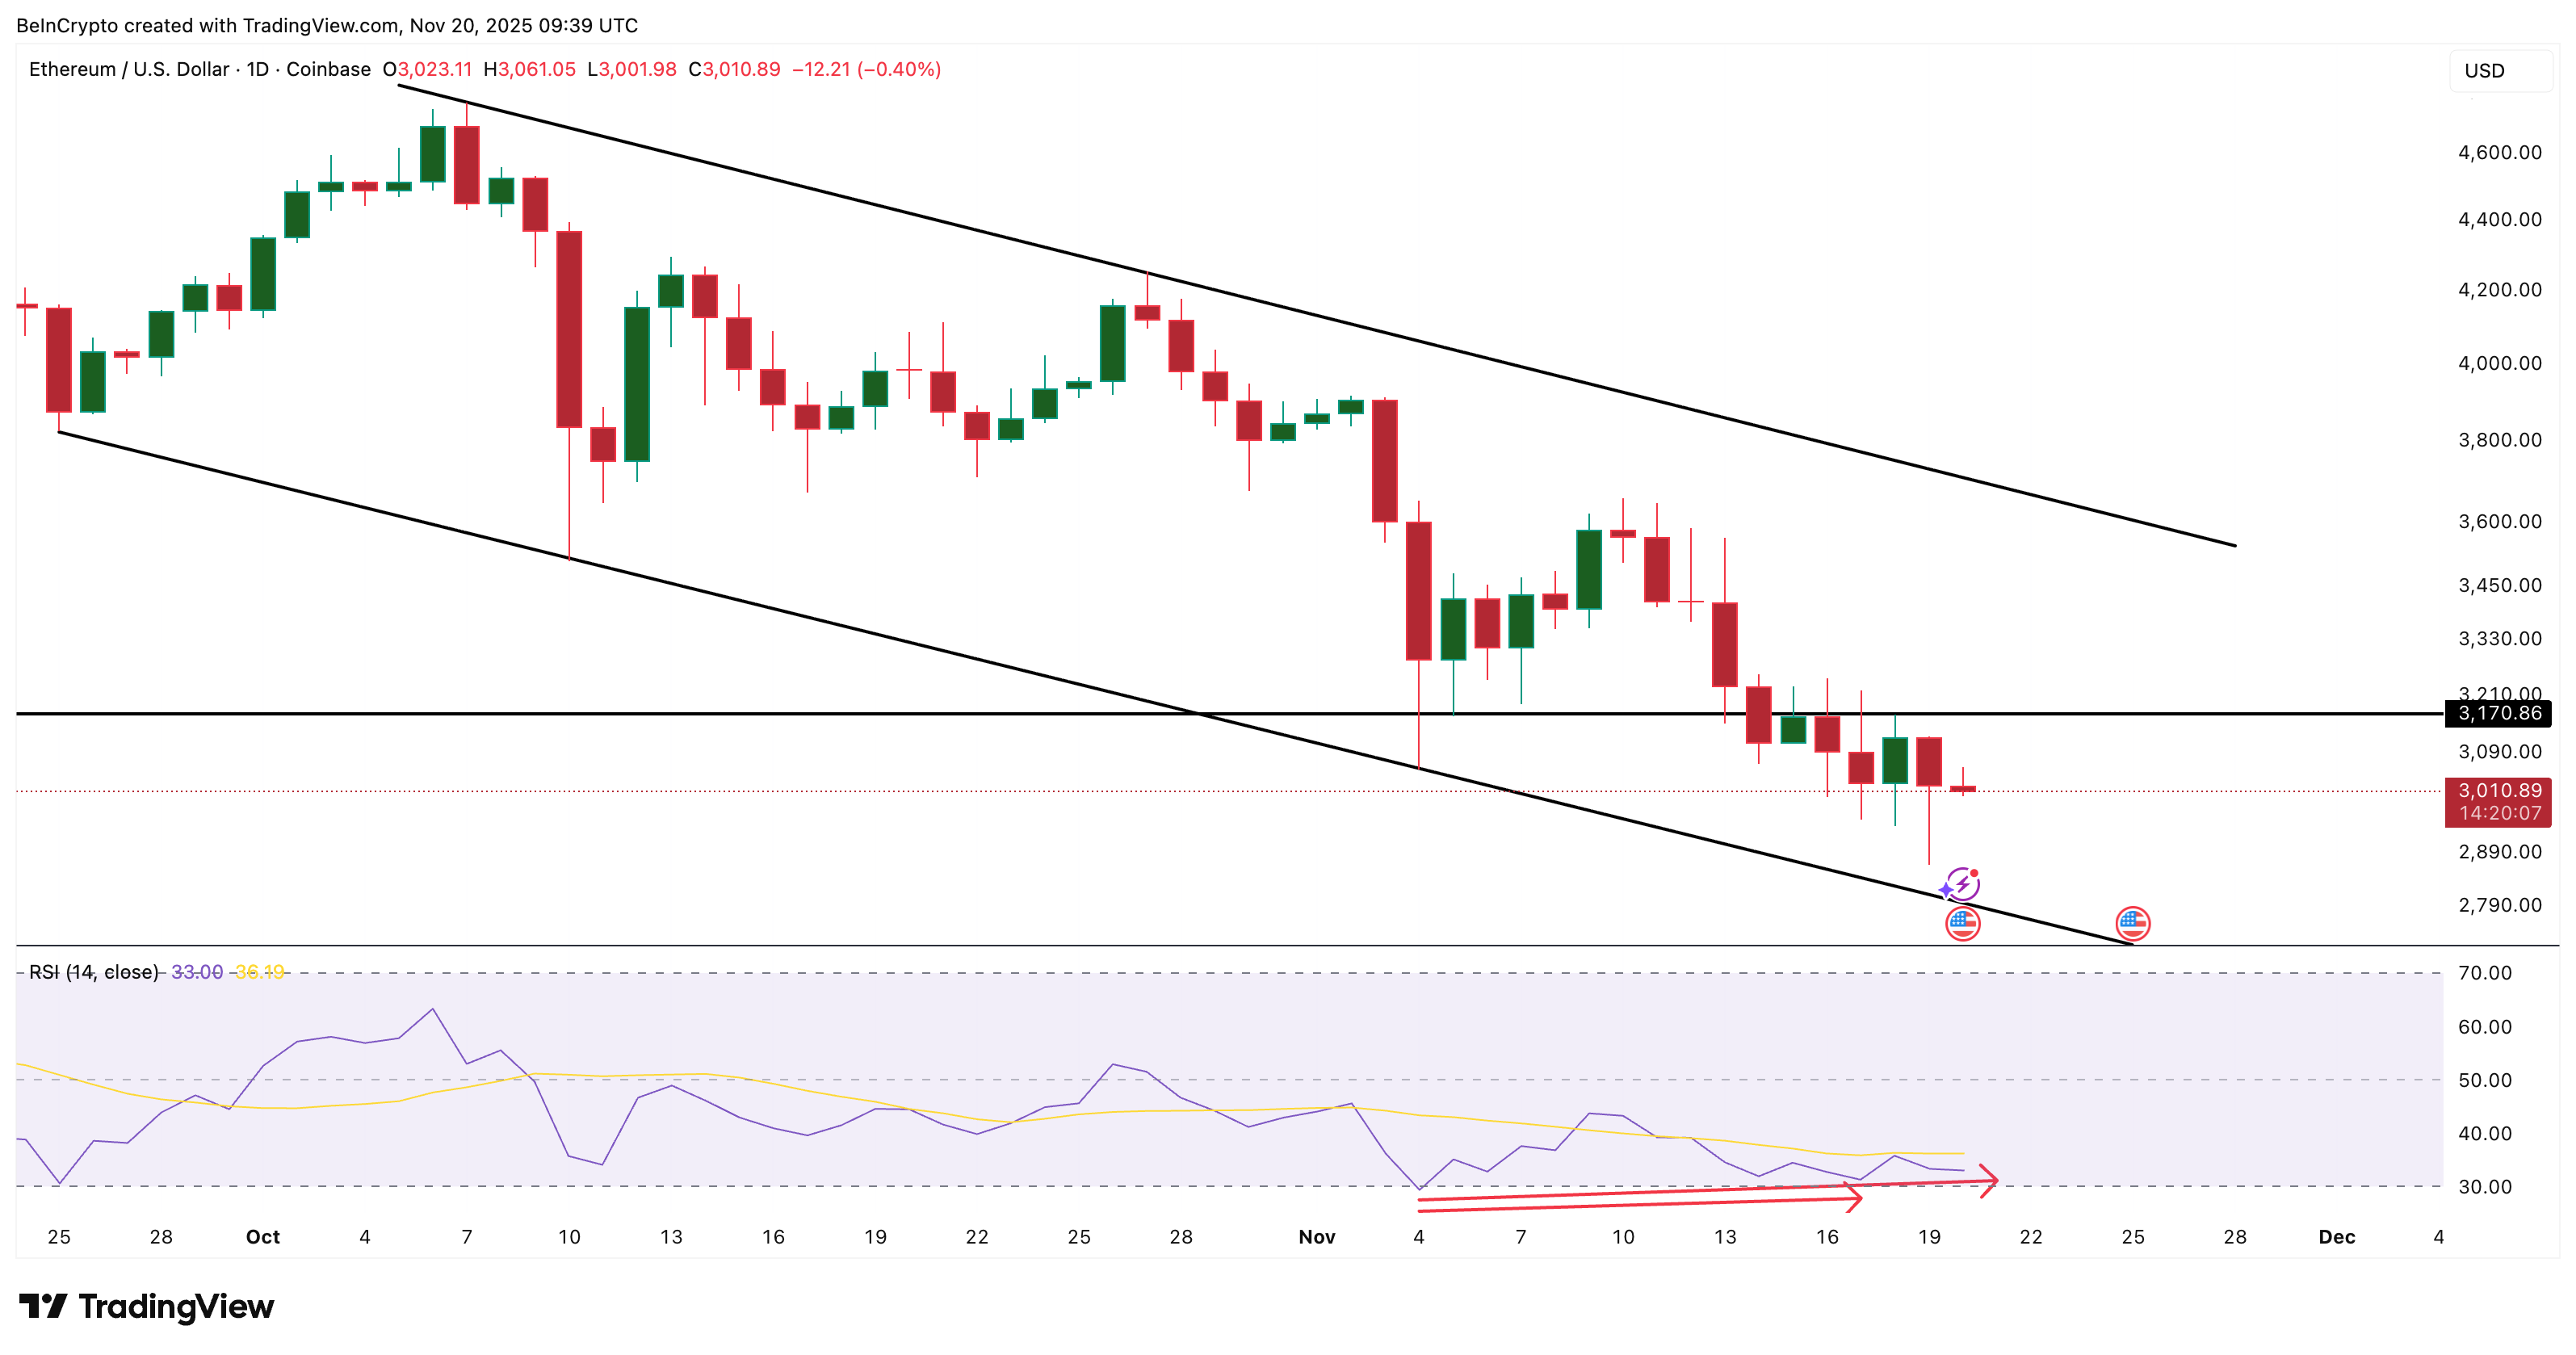
Ethereum price is trying to reverse, but the chart keeps running into the same problem: the heavy $3,170 resistance wall. A fresh RSI divergence hints at early strength, yet long-term holders are still net sellers and a major supply cluster sits directly overhead. Unless Ethereum breaks above $3,170 on a daily close, every bounce will stay fragile and the broader trend remains bearish.
The Ethereum price is slightly red today, near $3,013, down about 1.8%, while Bitcoin stays marginally green. The underperformance is not new. Ethereum has also dropped nearly 23% this month, again weaker than Bitcoin.
There is a fresh reversal attempt on the chart, but this setup has already failed once. It will likely fail again unless one key level finally breaks.
RSI Shows a Clear Bullish Divergence, but History Says It Can Still Fail
A clean bullish divergence has formed between Nov. 4 and Nov. 19. The price made a lower low, but the RSI, a momentum indicator that measures whether price moves are strong or weak, made a higher low. Divergences like this often appear before a trend flip because RSI turns earlier than price.
 Ethereum Flashes Reversal Signs:
TradingView
Ethereum Flashes Reversal Signs:
TradingView
Want more token insights like this? Sign up for Editor Harsh Notariya’s Daily Crypto Newsletter here.
But Ethereum showed the same signal earlier, from Nov. 4 to Nov. 17, and it still failed. Both reversal attempts ran into the same wall: $3,170. The chart is flashing the right signal, but the structure behind it is not supportive yet.
Reversal Keeps Failing: Selling Pressure and a Heavy Supply Cluster?
Long-term holders are not backing the bounce. The Hodler Net Position Change, which tracks wallet flows of investors, remains negative. On Nov. 18, long-term holders were already net-negative by 524,819 ETH, but that number widened to 583,171 ETH on Nov. 19.
That means another 58,352 ETH—around $175 million at current prices—moved into selling pressure within 24 hours. Until this shifts, any RSI-based reversal stays fragile.
 HODLers Keep Selling ETH:
Glassnode
HODLers Keep Selling ETH:
Glassnode
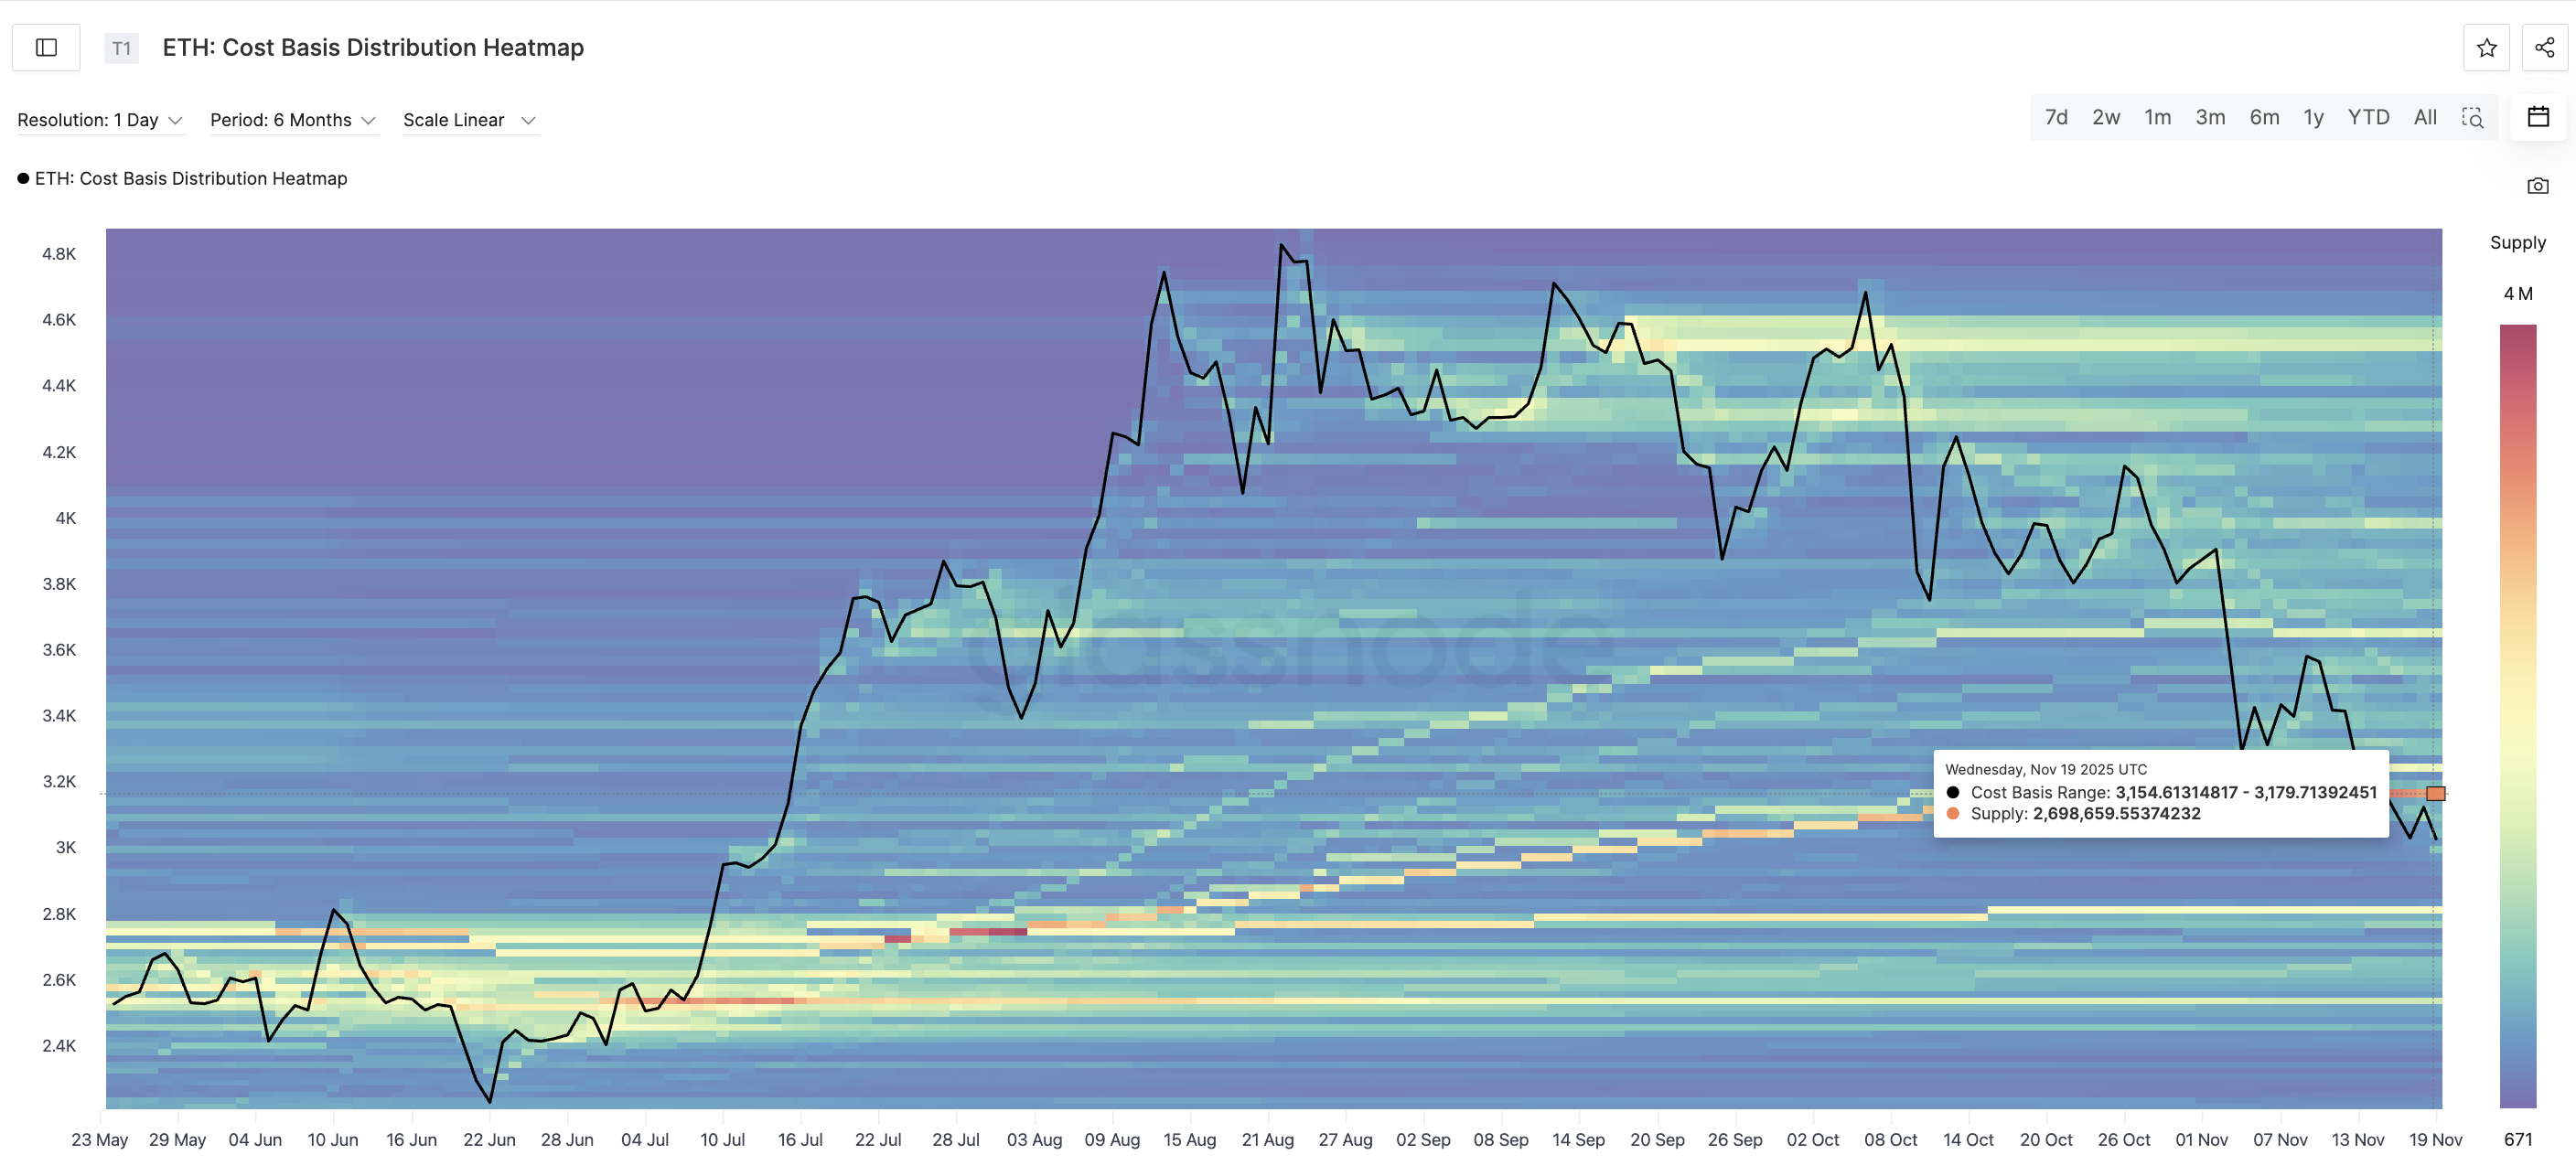
The cost-basis heatmap, the indicator showing key supply clusters, explains the rest. The strongest supply block in months sits between $3,150 and $3,170, holding about 2.69 million ETH. This zone is highlighted in orange on the heatmap and has rejected every attempt to move higher. This is also the zone where the previous divergence attempt failed on Nov. 17.
 Strongest ETH Supply Clusters:
Glassnode
Strongest ETH Supply Clusters:
Glassnode
With long-term holders selling and a heavy supply wall stacked above the price, the Ethereum price reversal setup keeps getting crushed before it can play out.
Ethereum Price Stays Stuck in a Downward Channel Until $3,170 Breaks
The Ethereum price continues to trade inside a descending channel. The 0.382 Fibonacci level at $3,170 lines up perfectly with the same resistance cluster. This means $3,170 is not just a chart level — it is the structural pivot for the entire trend.
 Ethereum Price Analysis:
TradingView
Ethereum Price Analysis:
TradingView
Unless Ethereum posts a daily close above $3,170, every bounce will remain temporary, and the trend stays bearish.
If the breakout finally happens, the next target is $3,656, the upper Fibonacci zone where momentum can reset. Until then, price is vulnerable to another sweep of the lower channel range. Also, failure to cross $3,170 and the inability to hold $3,056 could push the Ethereum price to the channel’s lower boundary.
Read the article at BeInCryptoDisclaimer: The content of this article solely reflects the author's opinion and does not represent the platform in any capacity. This article is not intended to serve as a reference for making investment decisions.
You may also like
Bitcoin Dominance Nears 60% as Altcoins Lag Behind
Bitcoin dominance hits 60% in November as traders move capital to BTC during broader market pullback, reports NYDIG.Why Bitcoin Outperforms in Bearish ConditionsWhat This Means for the Market

Altcoins Shine as Spot ETF Flows Shift
Bitcoin and Ethereum see heavy outflows, while Solana and XRP gain momentum in last week’s Spot ETF flows.Solana and XRP Attract Investor Confidence

SEI Perpetuals Surge 3x in Just 30 Days
SEI perpetual contracts have tripled in value over the last 30 days, reflecting a strong surge in market interest.What’s Driving SEI’s Growing Popularity?Can SEI Sustain the Momentum?

Bitcoin Forecasts Dip to $78K in 2025
Kalshi traders now expect Bitcoin to hit a low of $78K in 2025, indicating a more optimistic outlook for BTC.Why This Matters for InvestorsA Bullish Floor or Overconfidence?