XRP Flashes a Bottoming Signal; Yet the Price Recovery Looks Delayed

The XRP price trades near $1.90, down about 9% over the past 24 hours and extending its 30-day decline to around 19%. A few bottoming signals have appeared, especially from short-term holders. But the XRP price still looks far from a recovery. This piece explains why the bounce has not happened yet. Short-Term Capitulation Has
The XRP price trades near $1.90, down about 9% over the past 24 hours and extending its 30-day decline to around 19%. A few bottoming signals have appeared, especially from short-term holders.
But the XRP price still looks far from a recovery. This piece explains why the bounce has not happened yet.
Short-Term Capitulation Has Appeared, but the Recovery Is Missing
The short-term holder NUPL, which measures net unrealized profit or loss, has dropped to –0.30, its lowest reading this year. This level marks capitulation, a phase where most recent buyers are holding losses and are either forced to exit or emotionally flushed out.
Earlier local XRP bottom signals like this have led to clean rebounds.
In April, NUPL fell to –0.13 and XRP bounced.
In June, NUPL fell to –0.15 and XRP bounced again.
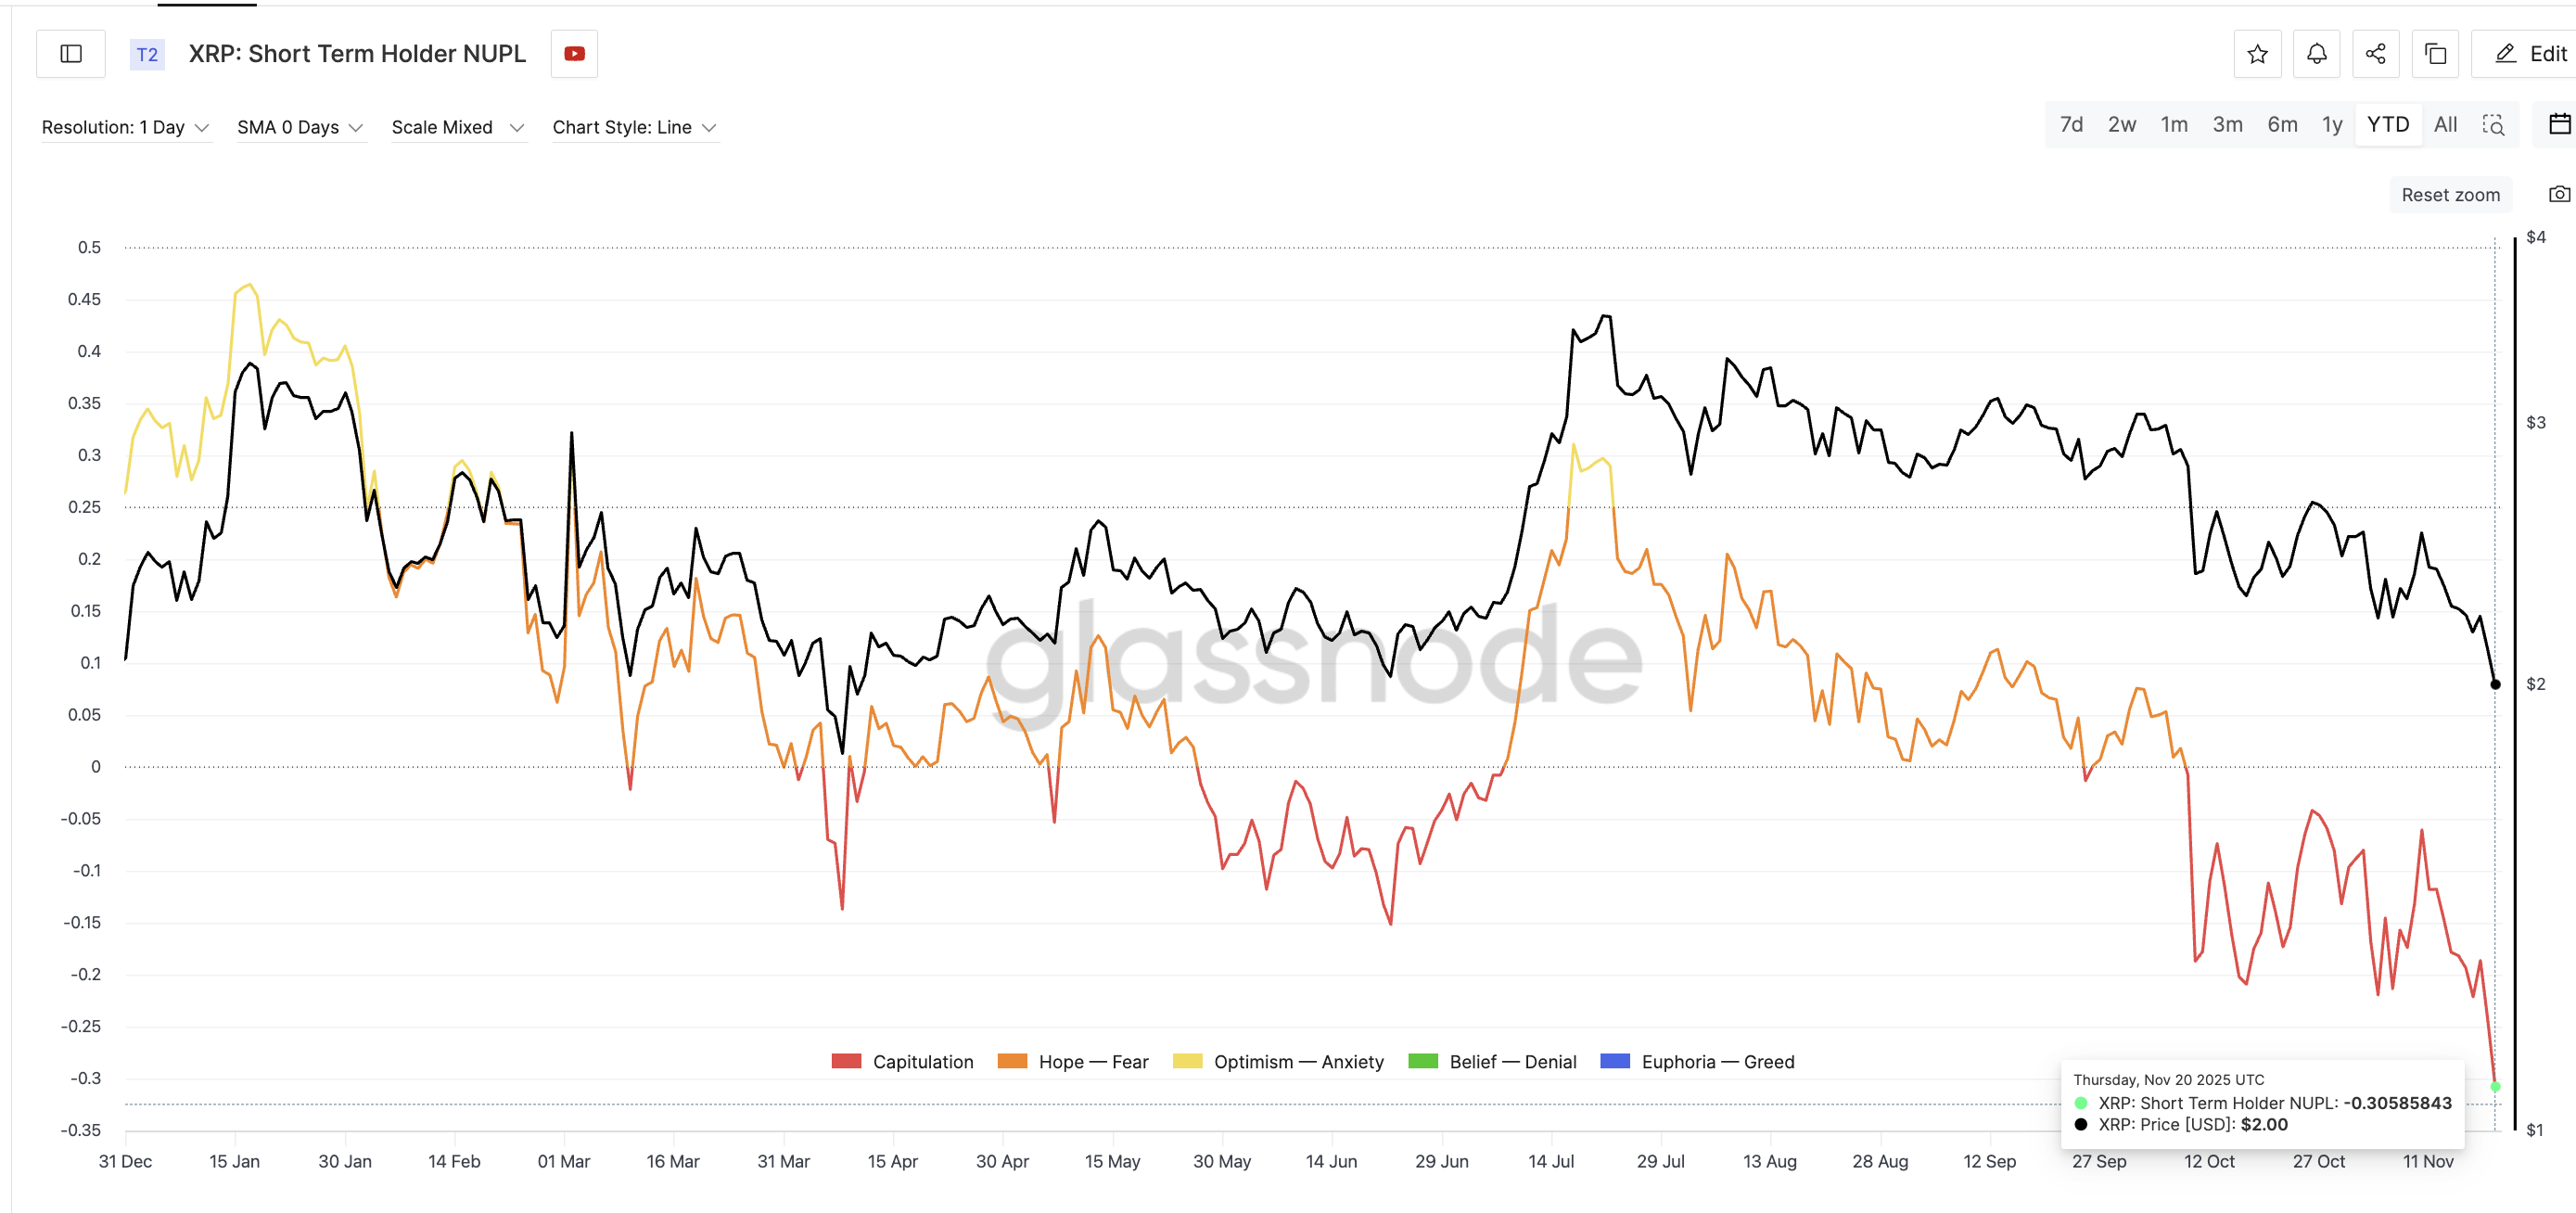 Key Bottoming Signal:
Glassnode
Key Bottoming Signal:
Glassnode
Want more token insights like this? Sign up for Editor Harsh Notariya’s Daily Crypto Newsletter here.
This time, despite a deeper capitulation reading, XRP is still sliding. The missing element comes from the spent coins data.
Spent Coins Show Peak Capitulation Has Not Fully Played Out
The spent coins age band metric shows how many XRP coins from different age groups are being moved. When spent coins rise while price falls, it shows real capitulation pressure. This metric doesn’t only include the short-term holders and might also show how aggressively the long-term and mid-term holders are moving XRP.
A strong example came earlier this month.
Between November 2 and November 5, the price dropped from $2.54 to $2.15. During the same period, spent coins increased from 20.32 million to 104.85 million. This was a rise of about 416%, which marked a clear capitulation event. That ensured a local bottom formation on November 5.
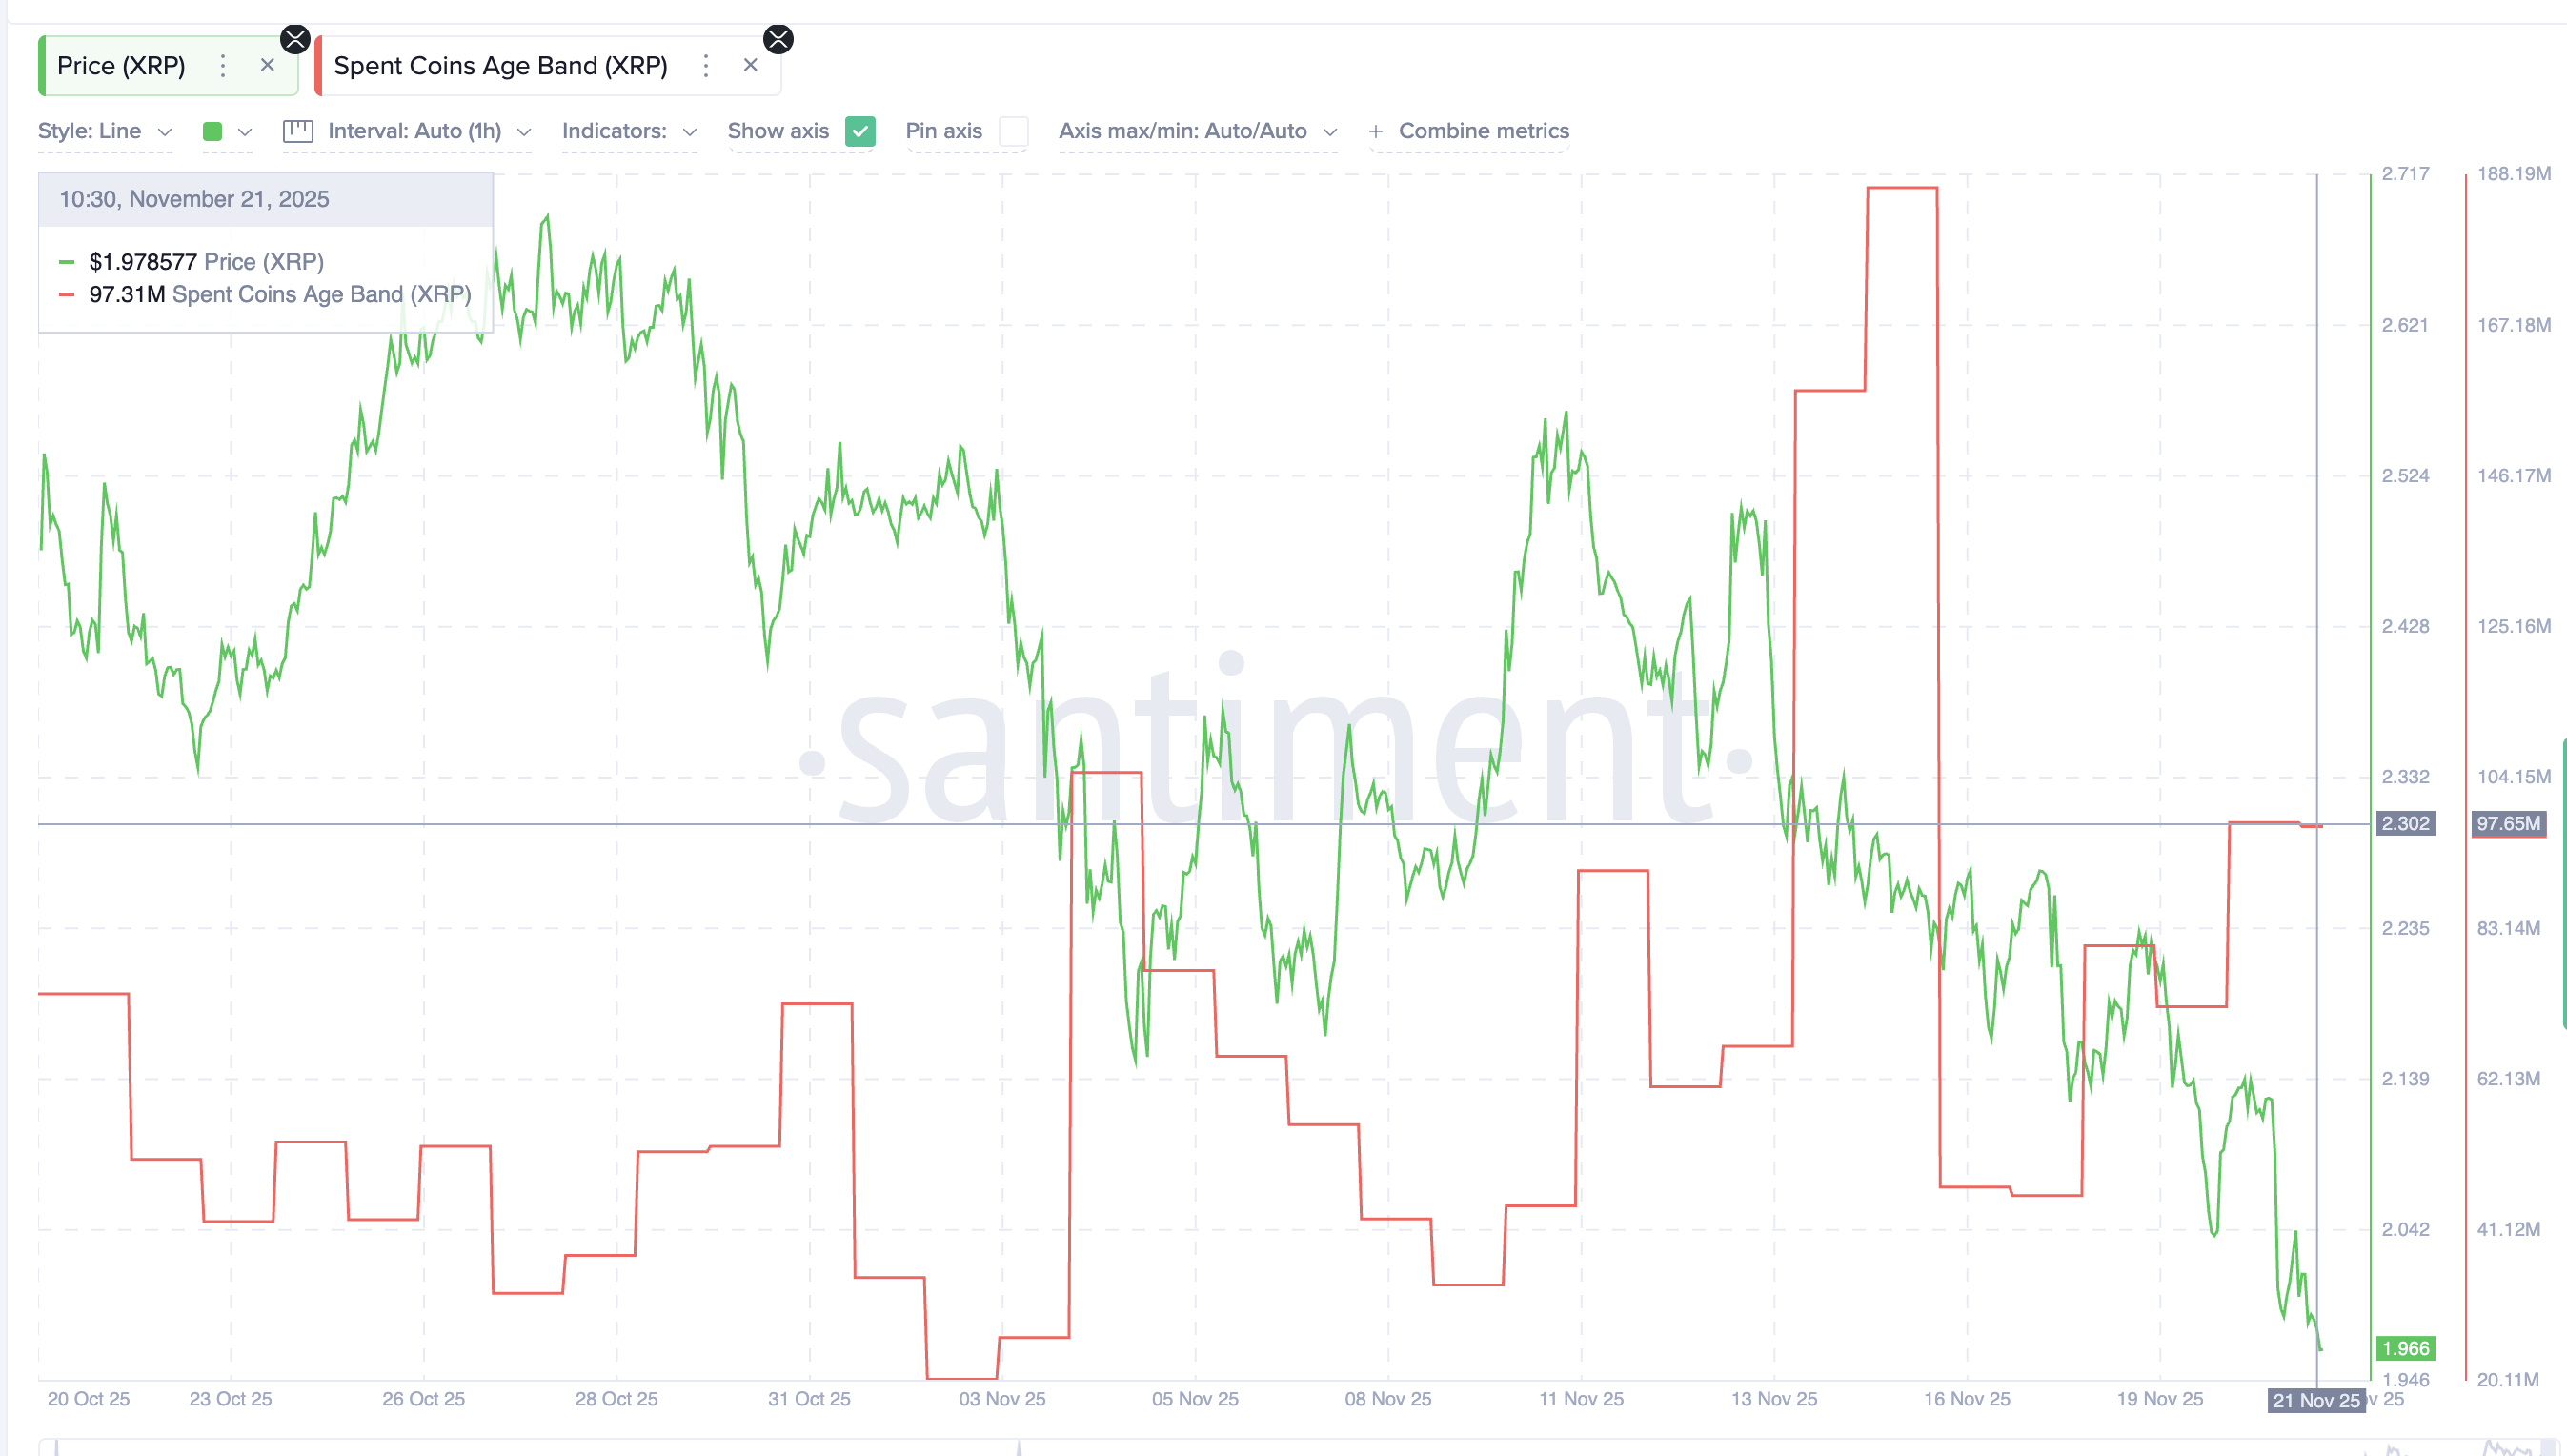 XRP Coins Keep Moving During The Dip:
Santiment
XRP Coins Keep Moving During The Dip:
Santiment
The current structure, coins moving while the price corrects, is similar but much smaller.
Between November 17 and now, the XRP price dropped from $2.27 to $1.96. Spent coins increased from 45.87 million to 97.31 million, a rise of about 112%.
Since 112% is far below the earlier 416% spike, the washout phase may not be complete. If spent coins continue rising toward early-November levels, the XRP price may see more downside before the final bottom forms.
This incomplete washout explains why the short-term capitulation reading has not triggered a recovery yet. And why some more XRP price downside could be waiting.
XRP Price Levels Suggest One More Downside Zone
XRP sits close $1.95, an important support. Losing this level exposes the next zone near $1.57, which could highlight the final XRP bottom if capitulation continues. The price is currently under the support, but for a breakdown confirmation, it needs a clean daily close under $1.95.
One more risk is building on the chart. The 100-day exponential moving average (EMA) is moving closer to the 200-day average. If the 100 moves below the 200, traders treat it as a bearish crossover. And that could be a bigger short-term correction catalyst.
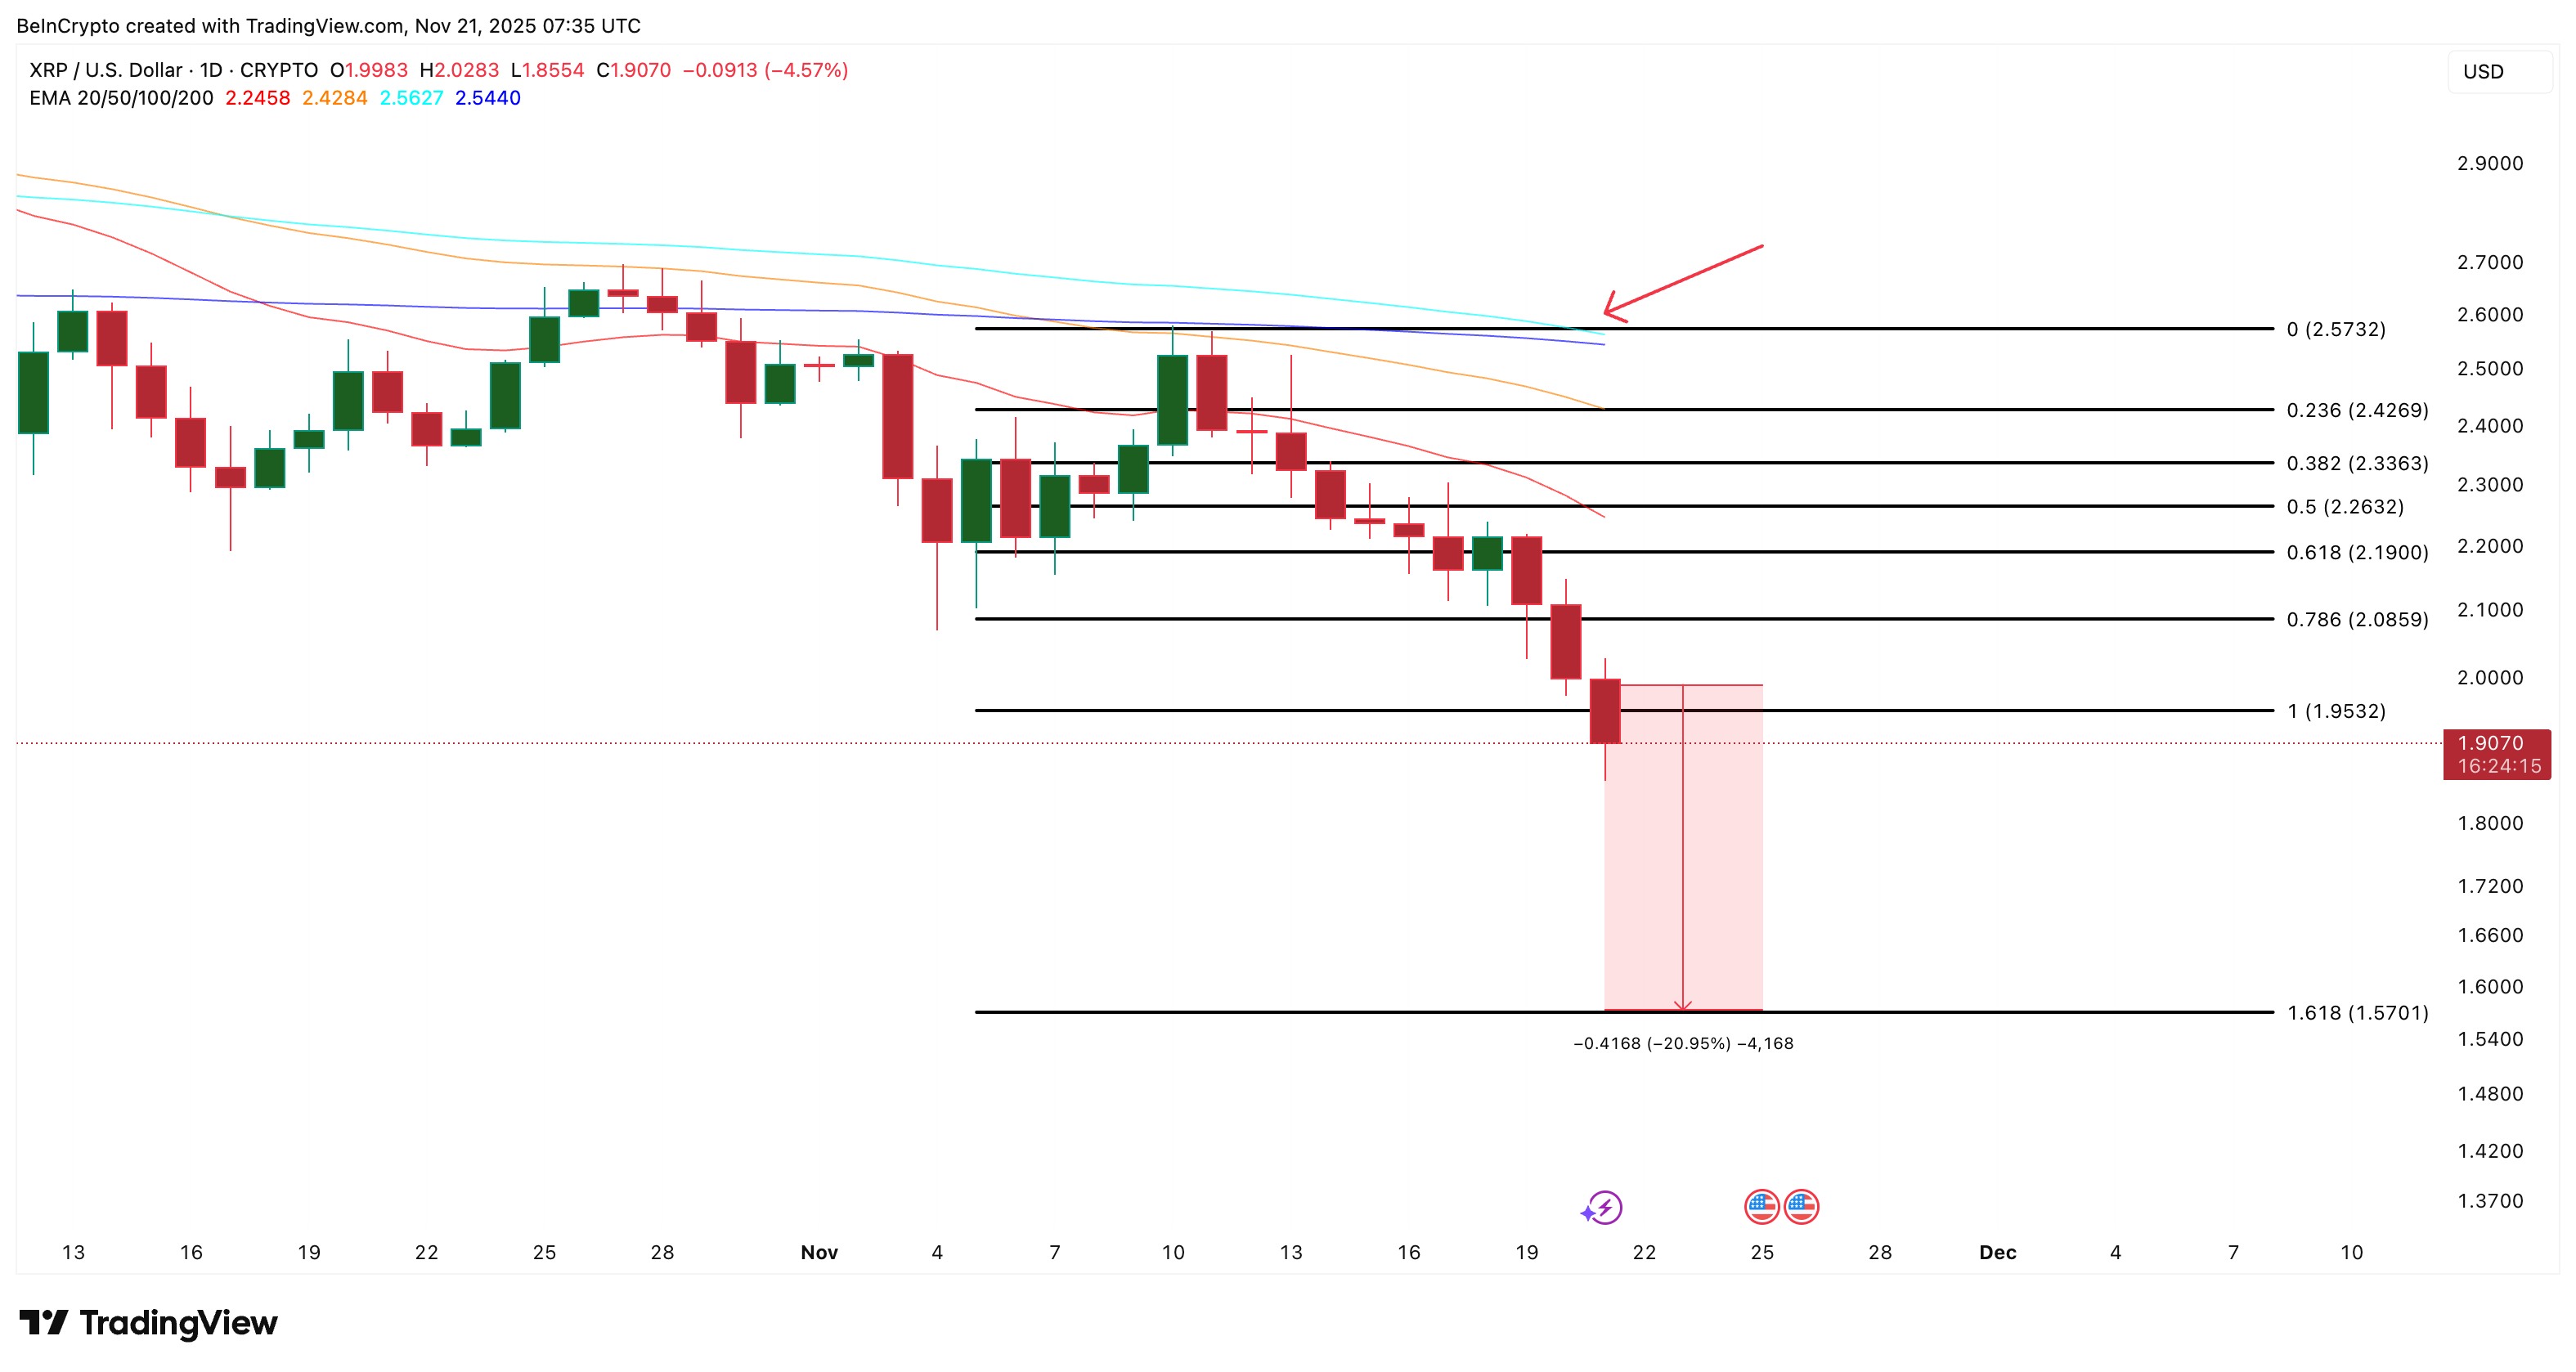 XRP Price Analysis:
TradingView
XRP Price Analysis:
TradingView
An exponential moving average (EMA) gives more weight to recent prices, so it reacts faster than a simple moving average and helps confirm short-term pressure.
For the XRP price to show early strength, it must first reclaim $2.08, followed by $2.26. That would invalidate the near-term bearish trend.
Read the article at BeInCryptoDisclaimer: The content of this article solely reflects the author's opinion and does not represent the platform in any capacity. This article is not intended to serve as a reference for making investment decisions.
You may also like
Switzerland Postpones Crypto Tax Data Exchange to Meet Technological and International Requirements
- Switzerland delays crypto tax data sharing until 2027, aligning with global regulatory reevaluations amid evolving tech and market dynamics. - SGS acquires Australia's Information Quality to boost digital revenue, reflecting Swiss firms' expansion into tech-driven compliance solutions. - Canada's Alberta oil sands policy shift highlights governments prioritizing economic growth over strict climate regulations, mirroring Switzerland's approach. - BridgeBio's precision medicine and Aires' EMF solutions dem

Switzerland's Focus on Privacy Conflicts with International Efforts for Crypto Taxation
- Switzerland delays crypto tax data sharing with international partners until 2027, contrasting with global regulatory efforts to close offshore loopholes. - The U.S. advances implementation of the OECD's CARF framework, aiming to automate reporting on foreign crypto accounts by 2029. - CARF requires foreign exchanges to report U.S. account details, mirroring traditional tax standards and targeting crypto tax evasion. - Switzerland's privacy-focused stance highlights tensions between financial confidentia

Zcash News Update: Reliance Shifts Entirely to Zcash, Citing Privacy and Regulatory Alignment
- Reliance Global Group, a Nasdaq-listed fintech firm, shifted its entire crypto portfolio to Zcash (ZEC), divesting Bitcoin , Ethereum , and other major coins. - The strategic pivot, announced November 25, prioritizes Zcash's privacy-focused zk-SNARKs technology for institutional compliance and selective data disclosure. - Zcash's 1,200% 90-day price surge and Grayscale's ETF filing highlight growing institutional interest in privacy-centric assets. - The move reflects broader crypto industry trends towar
Bitcoin News Update: Bitcoin Fear Index Drops to 22 While Investors Look for Signs of Market Rebound
- Bitcoin Fear & Greed Index rose to 22 from 20, indicating slight easing of extreme fear but persistent bearish sentiment. - Bitcoin stabilized near $87,000 after hitting $80,553, yet remains below key resistance levels amid $3.5B ETF outflows. - Structural factors like leverage and liquidations drive selloffs, with ETF redemptions correlating to 3.4% price drops per $1B outflow. - Analysts note oversold technical indicators and waning retail capitulation as potential inflection points for near-term rebou