Date: Mon, Nov 24, 2025 | 04:20 AM GMT
The cryptocurrency market is showing some relief at the start of the week following last week’s intense volatility, which dragged Bitcoin (BTC) to a low of $80,600 before recovering above $86,000. This recovery has helped several altcoins regain momentum, including Hedera (HBAR), which has surged over 8% from recent lows.
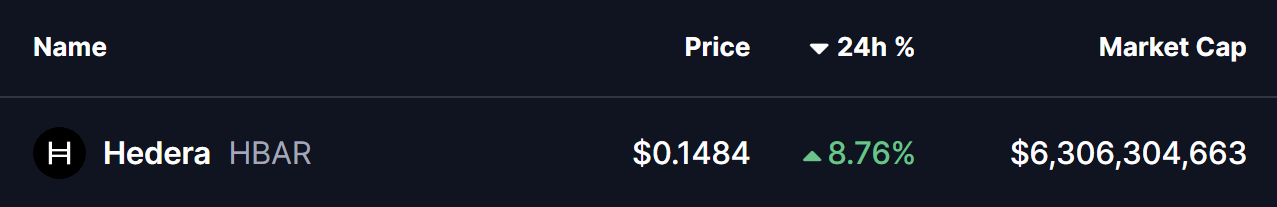 Source: Coinmarketcap
The latest price structure indicates that HBAR may be preparing for a significant directional move if critical support continues to hold firm.
Descending Triangle in Play
On the daily chart, HBAR is trading inside a descending triangle formation, a technical structure that often acts as a compression zone before a major breakout. This pattern has continued to narrow price movement, indicating a build-up of energy that could result in a sharp expansion in volatility.
HBAR recently experienced a steep 58% correction after getting rejected from the descending resistance trendline. The price then dropped into the crucial support region around $0.1223, where buyers stepped in aggressively. This rebound pushed the token back toward $0.1480–$0.1500, showing an early demand reaction and suggesting that bulls are actively defending the structure.
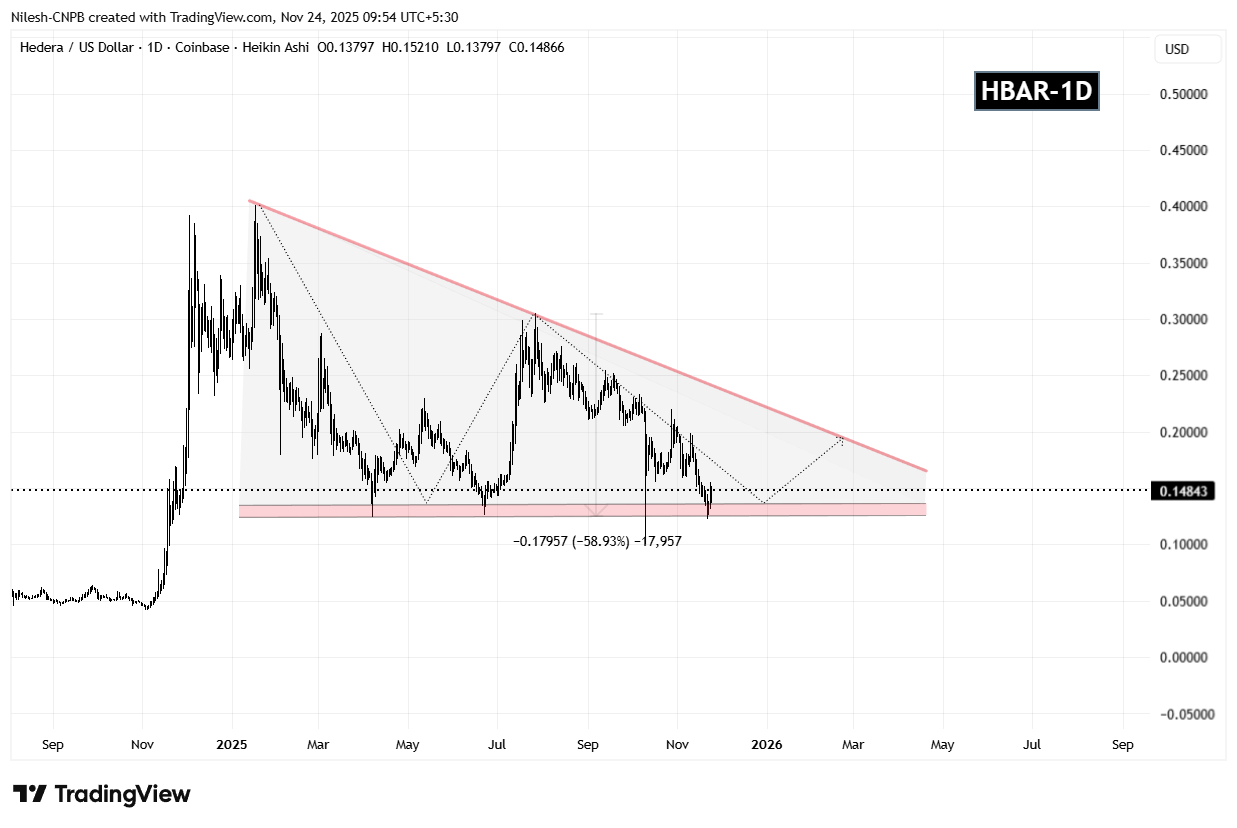 Hedera (HBAR) Daily Chart/Coinsprobe (Source: Tradingview)
The support zone around $0.1200–$0.1350 has repeatedly served as a strong demand layer throughout the triangle’s formation. Each time price approached this range, buyers absorbed selling pressure — making this region the foundation of the ongoing consolidation.
What’s Next for HBAR?
If HBAR continues to sustain above the support trendline, the next logical move would be a retest of the descending resistance near $0.1965. A breakout from this level accompanied by strong volume could mark the start of a new bullish cycle, opening the path toward higher targets and signaling a trend reversal from the prolonged corrective phase.
However, if price fails to remain above the support floor, bearish continuation risk increases. A breakdown below $0.1200 could trigger deeper declines, potentially invalidating the triangle setup and extending downside pressure into early 2026.
Market participants will now closely monitor the price interaction with the lower boundary, as the next move is likely to determine medium-term direction.