Bitcoin’s 9% Bounce Faces a Bearish Wall — Why Moving Past $88,000 Becomes Critical Now?

Bitcoin price is up about 2% today and has already gained almost 9.4% from this week’s lows near $80,400. The move looks solid, and the rebound was expected because of a technical signal that has worked before. But a major risk is building at the same time, near a key level. It could decide whether
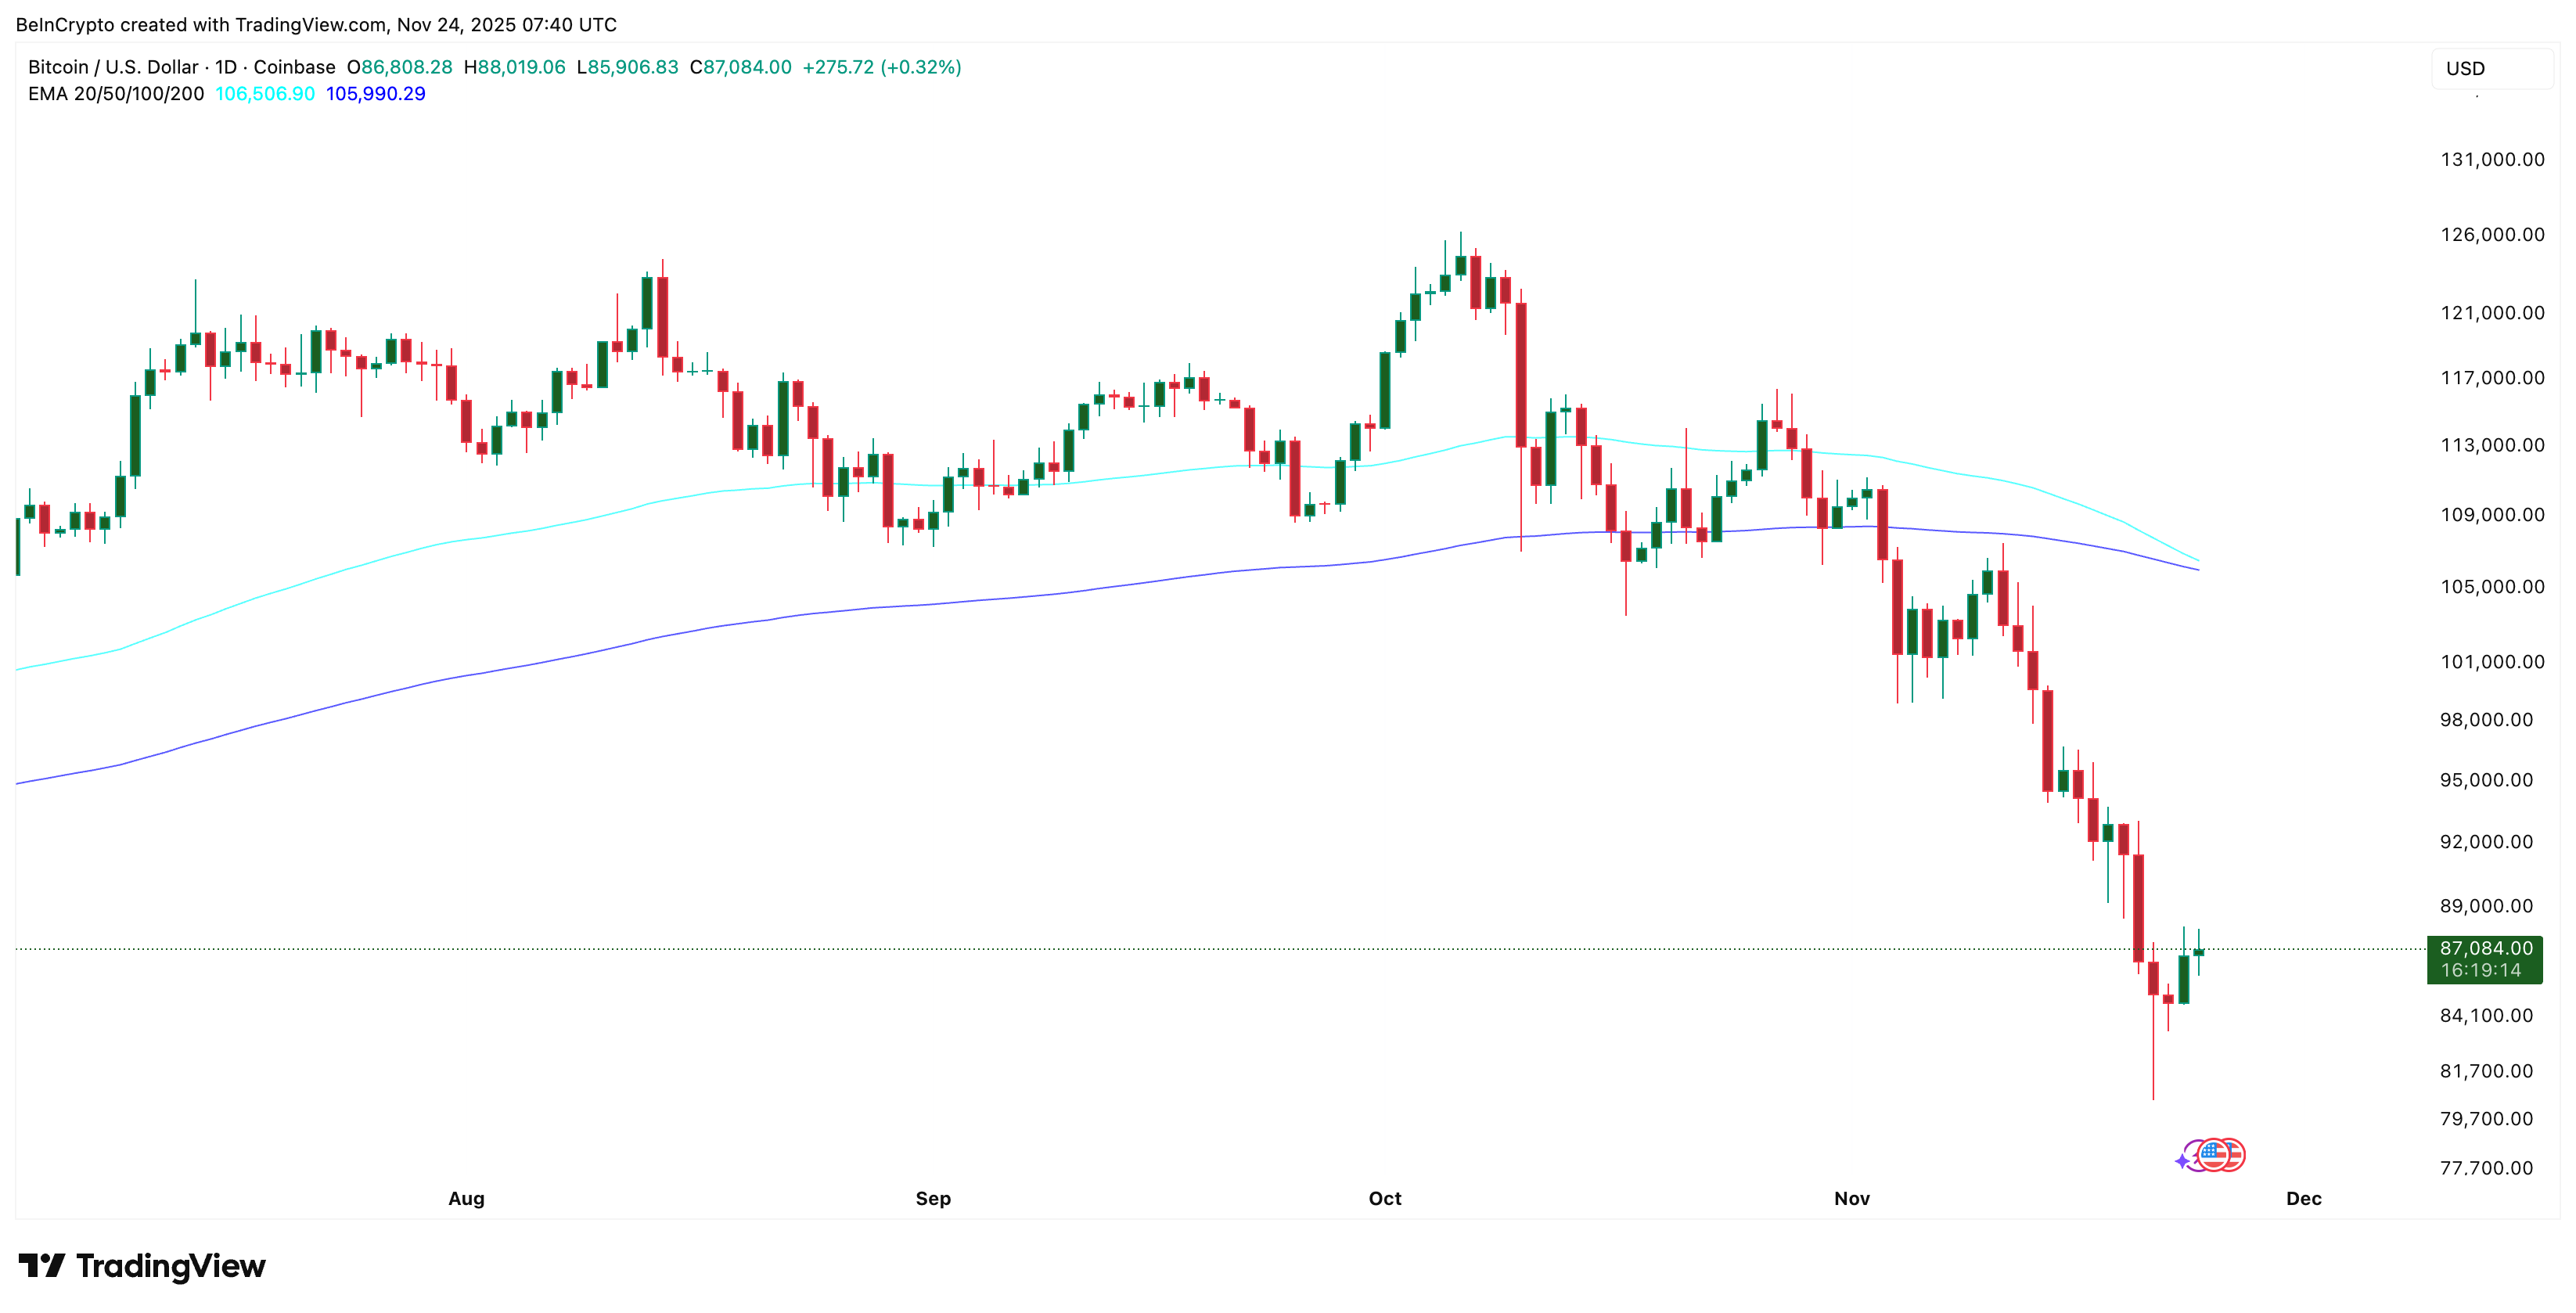
Bitcoin price is up about 2% today and has already gained almost 9.4% from this week’s lows near $80,400. The move looks solid, and the rebound was expected because of a technical signal that has worked before.
But a major risk is building at the same time, near a key level. It could decide whether this bounce continues or fails at the next barrier.
Why The Bounce Happened — And What Could Cap It Next
The first sign came from momentum.
Between April 8 and November 22, Bitcoin’s price made a higher low, but the Relative Strength Index (RSI) made a lower low. RSI measures whether momentum is rising or falling by comparing recent gains and losses. This pattern is called hidden bullish divergence. It shows sellers losing strength even while the chart looks weak.
The same setup appeared between April 8 and October 26, and that move created an 8.53% rebound. This time, Bitcoin has already climbed 9.38%, which means the signal played out again.
Want more token insights like this? Sign up for Editor Harsh Notariya’s Daily Crypto Newsletter
 Bitcoin’s Rebound Was Expected:
But the rebound now runs into a clear problem.
A bearish exponential moving average (EMA) crossover is forming. An EMA reacts faster than a simple moving average because it gives more weight to recent prices. Right now, the 100-day EMA is close to dropping under the 200-day EMA.
Traders treat this as a bearish crossover because it often points to downward pressure lasting for weeks. There is also BTC supply sitting overhead.
 Building Bearish Wall:
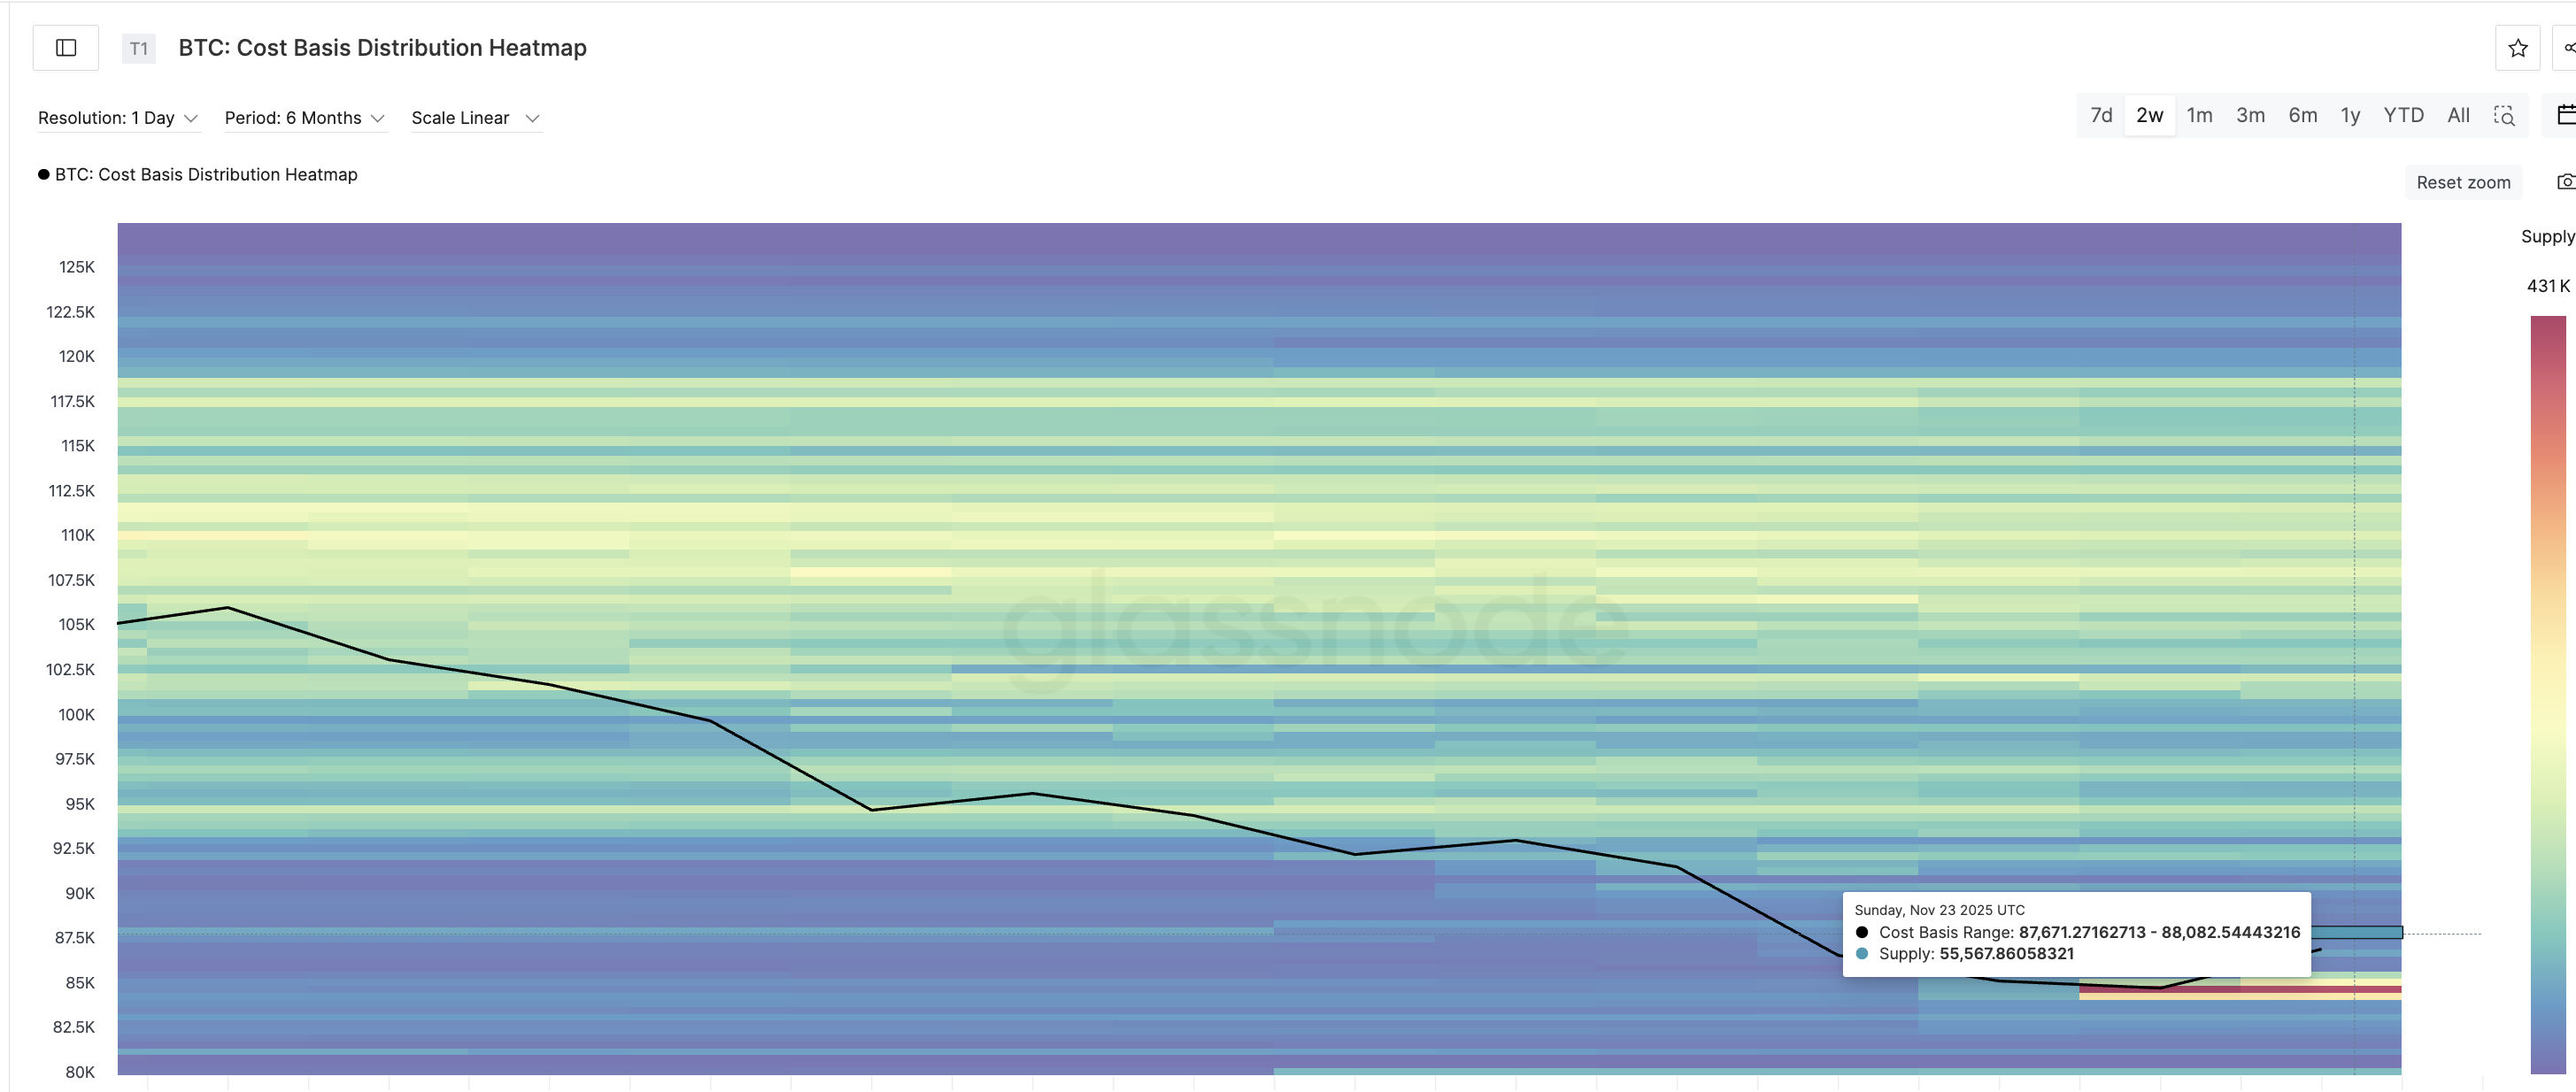
A heavy cluster now sits above the price between $87,671 and $88,082 — the level where many holders are waiting to sell at breakeven. This cluster holds about 55,567 BTC, currently worth almost $4.83 billion.
 BTC Supply Wall:
Most rebounds slow down when they hit these supply zones. So the bounce has momentum behind it, but it also faces its first major test almost immediately.
Bitcoin Price Levels That Decide Whether the Rebound Continues (Or Fails)
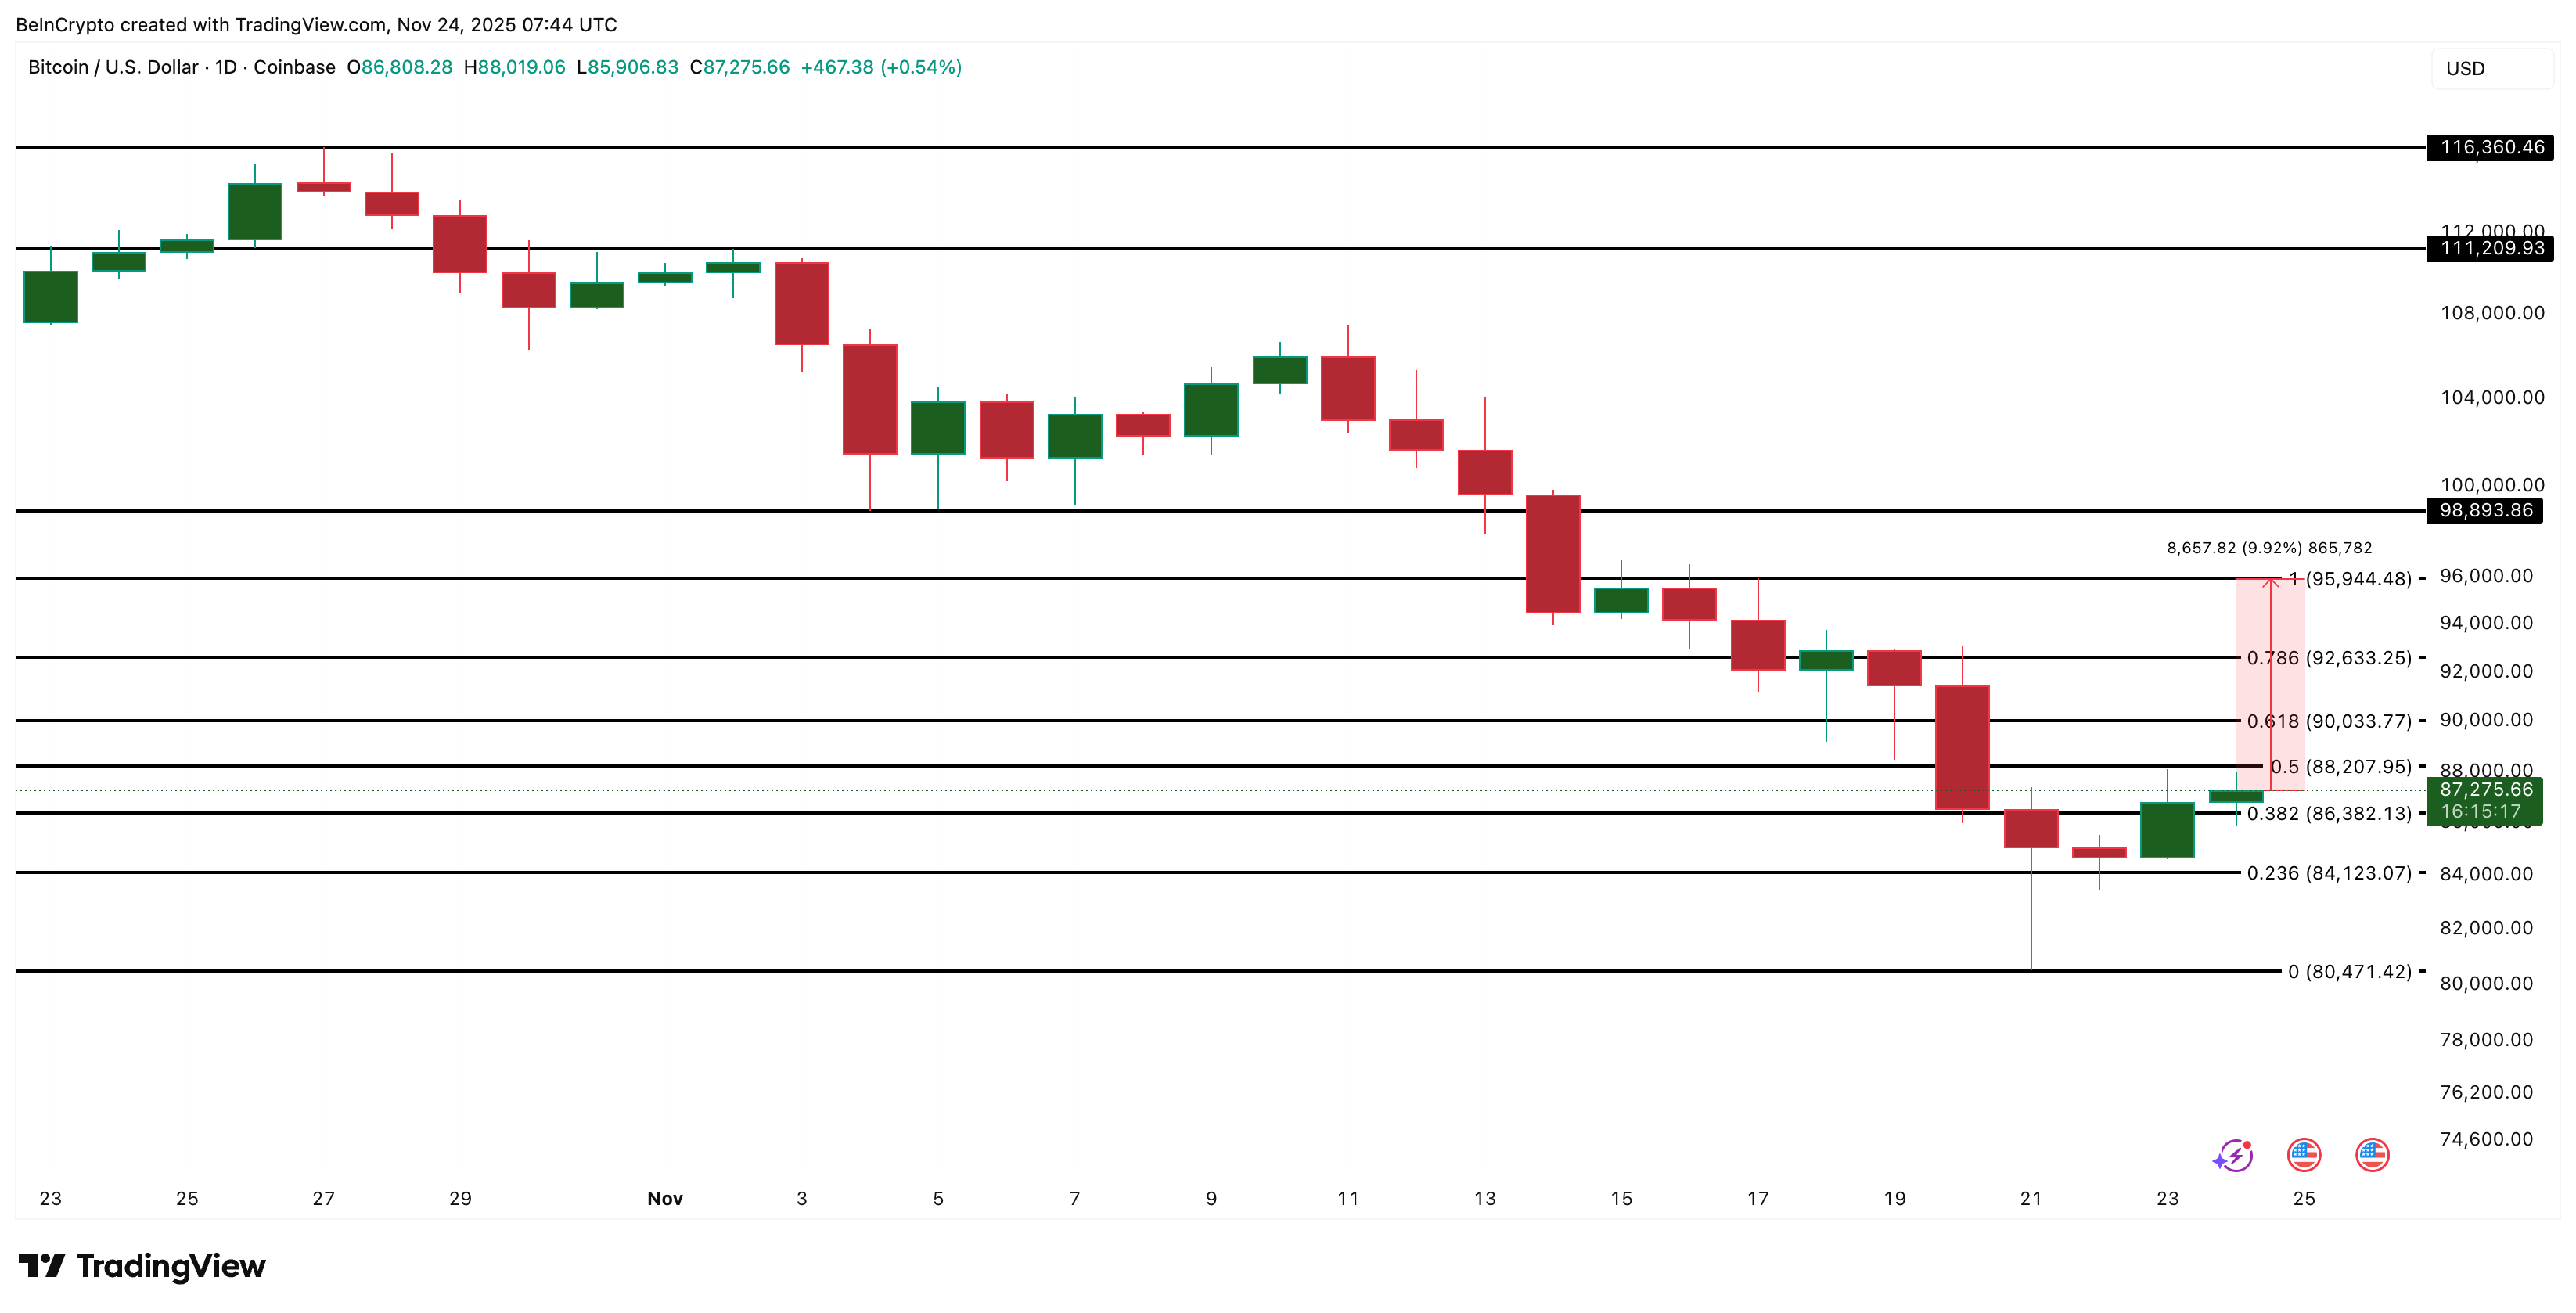
The zone around $88,000 now decides everything. Bitcoin must clear $88,200 to turn this bounce into something real. This area lines up with both the heatmap supply band and the 0.5 Fibonacci level from the recent drop.
A clean daily close above this range opens the path toward $92,600.
If buyers stay active, the next extension sits near $95,900 — the same region where the last major BTC price breakdown began.
 Bitcoin Price Analysis:
A stronger move only becomes possible if two things happen together:
- BTC Price rises above the $88,000 supply band, and
- The EMA crossover fails to complete.
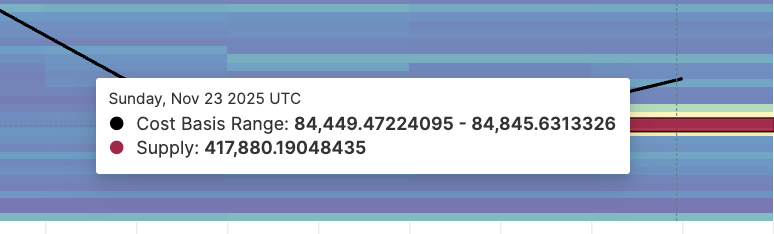
If the crossover finishes first, it usually caps the rebound and pushes the BTC price lower. On the downside, the $84,449–$84,845 band remains the strongest support, per the cost basis heatmap. That zone holds almost $35.38 billion worth of BTC.
 BTC Supply Zone Acting As Support:
On the price chart, the synonymous level sits at $84,100. Bitcoin flipped this cluster into a protective floor after breaking above it.
As long as this zone holds, deeper downside stays limited. If it breaks again, Bitcoin can drop toward the $80,000 region again, invalidating the rebound theory.
Disclaimer: The content of this article solely reflects the author's opinion and does not represent the platform in any capacity. This article is not intended to serve as a reference for making investment decisions.
You may also like
BTC drops 5.47% as large investor moves and ETF withdrawals contribute to market downturn
- Whale 0x5D2 holds a $106M 20x BTC short with $29.8M unrealized profit, adjusting take-profit to $67,000 amid falling prices. - A second whale adds $87.6M 3x BTC short, pushing Bitcoin below $92,000 liquidation threshold as bearish pressure intensifies. - U.S. Bitcoin ETFs see $3.5B November outflows, with BlackRock’s IBIT accounting for 63% of redemptions, accelerating BTC’s 21% monthly drop. - CEX outflows hit 29,194 BTC in seven days, while Binance gains 16,353 BTC inflow, signaling liquidity consolida

Bitcoin Slides Into Cleanup Phase Amid Trader Capitulation
Aave News Today: Transparent DeFi Protocols Drive Unprecedented Growth in Crypto Lending
- Galaxy Digital reports Q3 2025 crypto-collateralized lending surged to $73.59B, with DeFi lending up 54.84% to $40.99B. - DeFi now dominates 62.71% market share, driven by Tether's Plasma network ($3B in 5 weeks) and Aave's layer-2 expansion. - CeFi rebounded 37% to $24.37B but remains at 33.12% share, with Tether controlling 59.91% of tracked loans via Bitcoin/stablecoin collateral. - Market volatility intensified, with $19B in crypto futures liquidated in 24 hours, as protocols prioritize code-based co

Ethereum Updates: Bitcoin ETFs Plummet While Founder Increases Ethereum Holdings
- Bitcoin ETFs face $3.5B November outflows, worsening crypto market sell-offs as BlackRock's IBIT loses $2.2B. - BitMine Immersion founder Brandon Mintz expands Ethereum treasury to 3.63M ETH despite 28.7% price drop. - Leveraged ETH positions trigger partial liquidations, highlighting risks in volatile crypto markets. - Mintz's bullish Ethereum strategy contrasts with broader caution, emphasizing long-term staking potential. - Market duality emerges as ETF outflows persist alongside buybacks and asymmetr