Solana is attempting to stabilize after a sharp pullback that sent the asset toward the $121.50 Fibonacci zone earlier in the week. The market now watches whether this recovery can gain traction as traders assess fresh ETF developments and shifting derivatives positioning.
Price action on the 4H chart shows Solana reclaiming momentum indicators and challenging a familiar resistance area, creating a mix of optimism and caution across the market. The broader environment adds further complexity as futures interest rises and spot flows show uneven participation.
SOL Tests Mid-Range Resistance as Momentum Improves
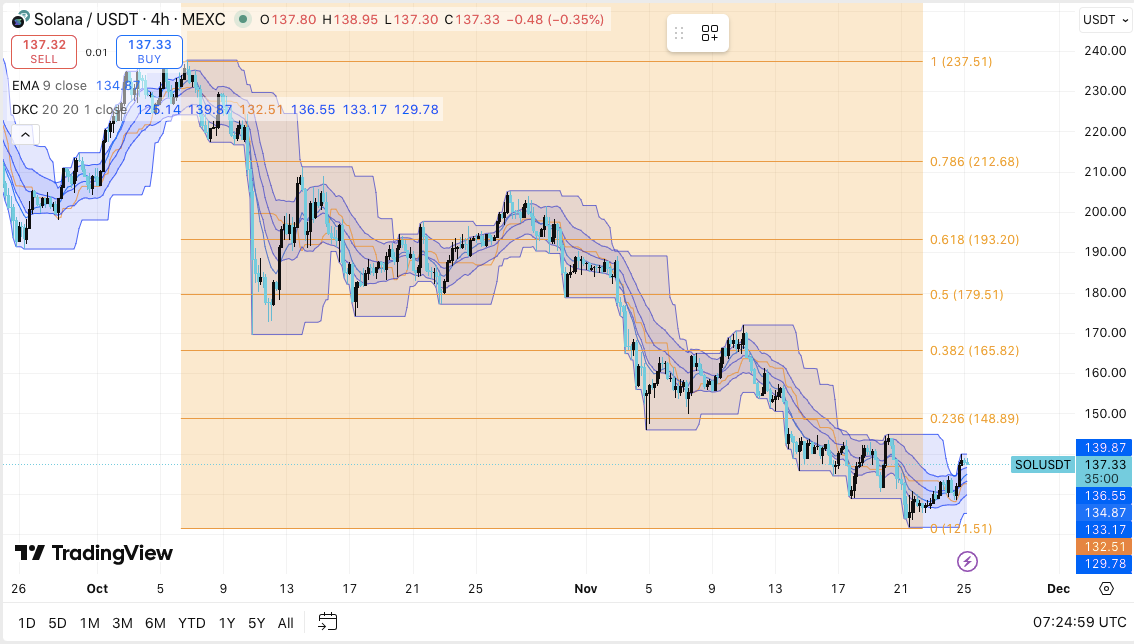
Solana trades near $137 to $138 after recovering from the recent local low. The move above the EMA9 and the mid-band of the DKC channel brings early strength into focus.
However, price still struggles to clear a short-term ceiling that has stalled several rallies this month. The resistance around $139.80 to $140 remains the first major test before any stronger structure can form.
 SOL Price Dynamics (Source: TradingView)
Additionally, support between $133.50 and $134.80 now acts as a key pivot. Holding this zone preserves the current push higher. A deeper retest near $129.80 may create more pressure and risk another move toward the recent bottom. Hence, market confidence hinges on how Solana behaves around these mid-range levels.
Derivatives Positioning Builds as Spot Flows Remain Mixed
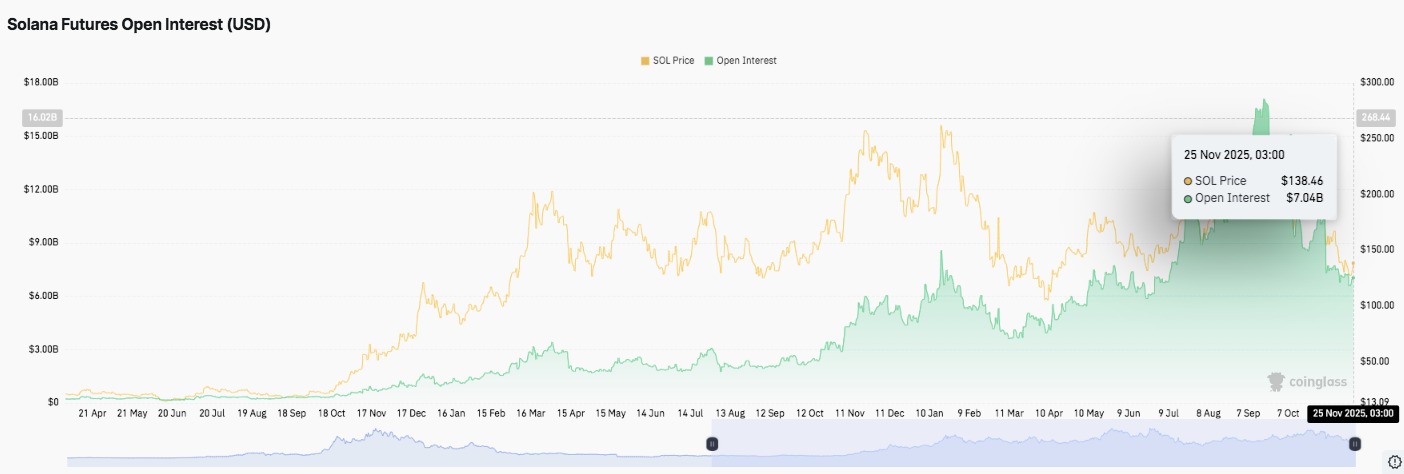
 Source: Coinglass
Open interest for Solana futures has grown significantly this year. The latest reading sits near $7.04 billion, showing strong participation during broader market expansions.
Moreover, traders continue to hold sizeable positions during pullbacks, signaling conviction despite volatility. This trend suggests that leveraged participants expect heavier swings as the market approaches major resistance clusters.
 Source: Coinglass
However, spot flows tell a different story. Outflows dominated much of the year, with heavy selling during July and September. Smaller inflow bursts followed dips, suggesting opportunistic accumulation rather than steady demand.
The most recent data shows an $8.84 million outflow on November 25 as Solana traded near $137. Consequently, sentiment remains fragile despite improving technical signals.
ETF Changes Add a New Layer to the Narrative
Franklin Templeton disclosed plans to expand its crypto index ETF from December 1. The addition of Solana, XRP, Dogecoin, Cardano, Stellar, and Chainlink aligns with recent Cboe rule updates.
Related: Monad (MON) Price Prediction 2025, 2026, 2027, 2028–2030
The broader inclusion of major assets increases visibility for Solana as institutional products reach deeper into the market. Moreover, the move strengthens long-term interest narratives even as short-term charts remain mixed.
Technical Outlook for Solana Price
Key levels for Solana remain well-defined as the market enters a new trading phase.
- Upside levels: $139.80–$140.00 as the first resistance cluster, followed by $148.80 (Fib 0.236) and $165.82 (Fib 0.382). A breakout above these regions could extend toward $179.50 and $193.20 as medium-term targets.
- Downside levels: $134.00 support at the EMA9 region, with $129.80 as the deeper retest area. Losing $129.80 exposes $121.50, the recent swing low.
- Major resistance ceiling: $148.80 remains the key level Solana must reclaim to flip sentiment back into a short-term bullish trend.
The technical picture shows SOL attempting to build a base after touching the $121.50 Fibonacci 0% zone. Price action is compressing beneath the $140 barrier, creating a structure where a decisive move can trigger volatility expansion in either direction.
Will Solana Break Higher?
Solana’s price outlook now depends on whether buyers can defend the $134 zone long enough to challenge the $140–$148.80 resistance belt. Sustained futures open interest above $7 billion hints at increased positioning, while spot outflows continue to signal caution.
If buyers regain momentum and push the price above $148.80, Solana could retest $165.82 and potentially stretch toward $179.50. Failure to hold $134 or $129.80, however, risks resetting the entire recovery and opening a path back toward $121.50.
For now, Solana sits at a pivotal inflection point. Price compression, rising leverage, and shifting ETF flows suggest heightened volatility ahead. The next decisive move will determine whether the short-term rebound evolves into a stronger trend reversal.


