XRP RSI Shows Neutral Momentum
XRP’s 14-period RSI on the 1-hour chart holds near 47.70, while the signal line trades around 49.35.
Both sit in the middle of the 30–70 band, which signals neutral momentum rather than clear strength or weakness.
XRP RSI 1 Hour Chart. Source: TradingView
Earlier in the period, RSI swings briefly reached the upper zone, then retreated from overbought territory.
Since then, readings have moved sideways around the midline. This action shows that the earlier buying wave has cooled, but sellers have not taken control.
With RSI hovering around 50, XRP trades in a consolidation phase. The indicator points to a market waiting for a fresh impulse, instead of flashing a strong reversal or a clear continuation signal on its own.
Trader Flags XRP Weekly 50-SMA Test as Risk Signal
The XRP/USD weekly chart from analyst Steph_iscrypto compares today’s structure with past cycle peaks in 2018 and 2022.
The chart plots XRP on Bitstamp against the 50-week simple moving average (SMA) in yellow and highlights three points where price met this line after major rallies.
![XRP Pennant Targets 11% Rally as Weekly Signal Flashes image 0]()
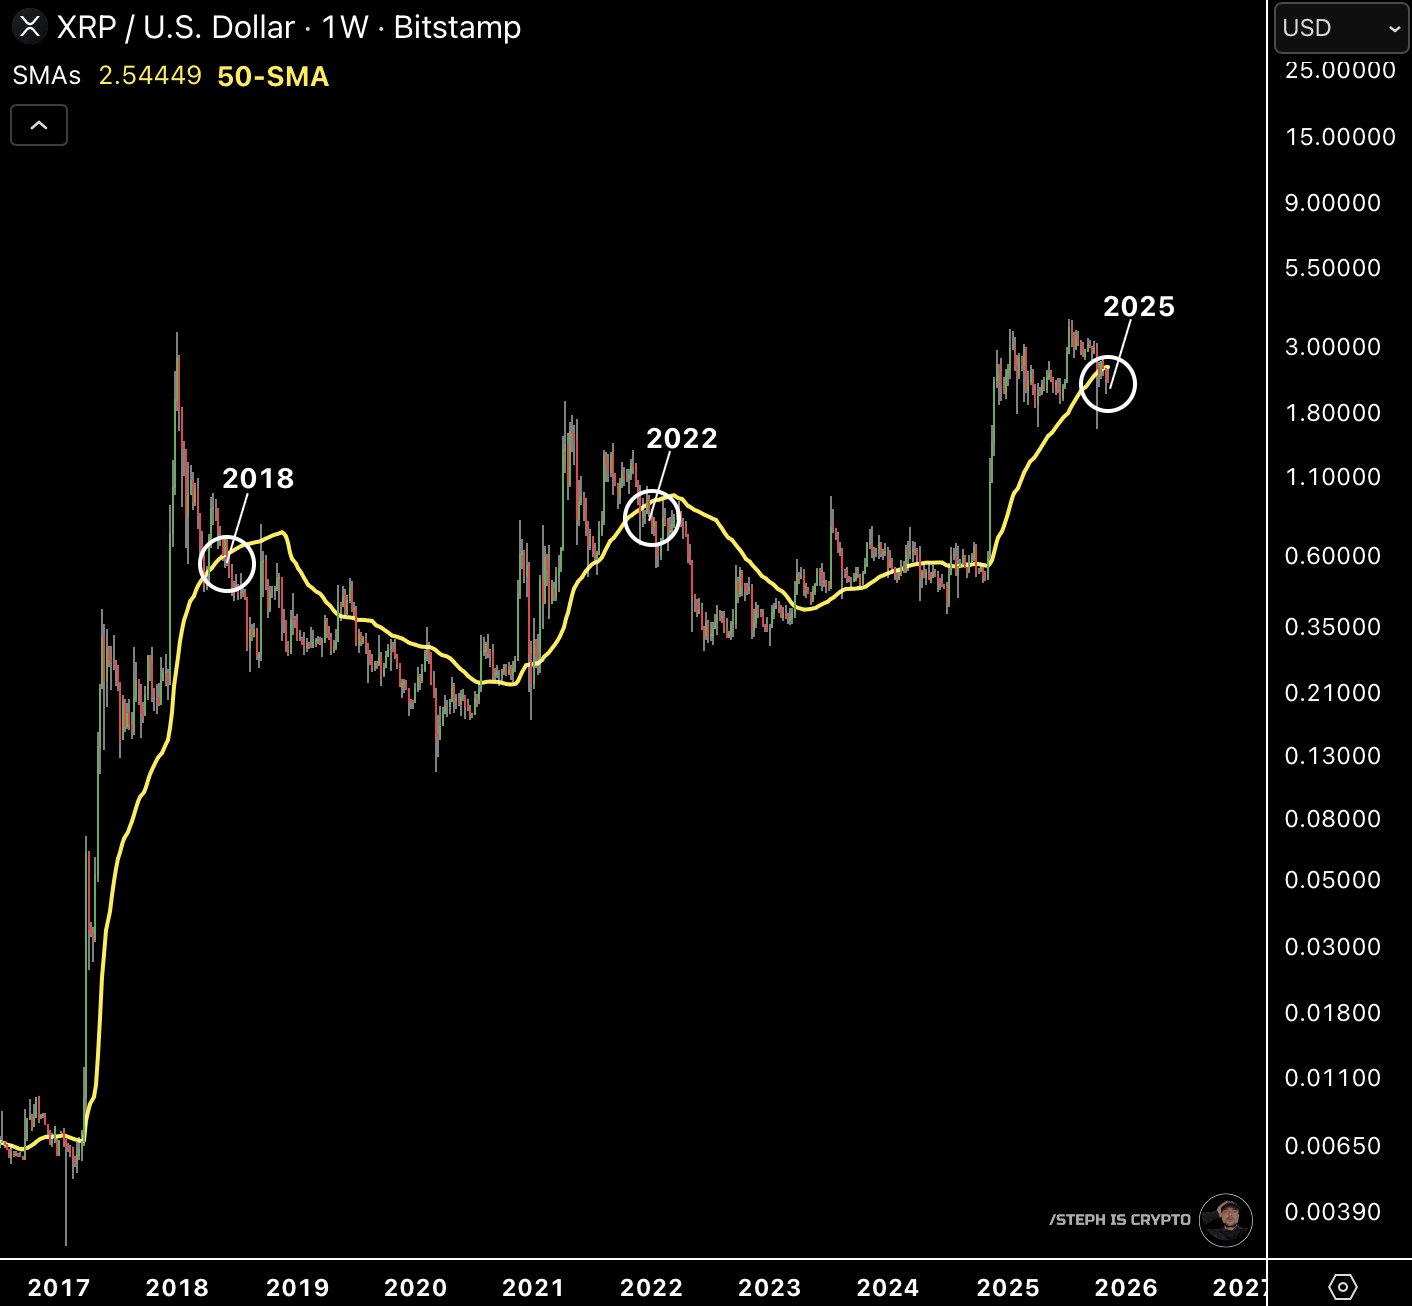
XRP Weekly 50 SMA Comparison. Source: Steph_iscrypto on X
In both 2018 and 2022, XRP first ran sharply higher, then rolled over and lost the 50-week SMA, which preceded extended downside periods.
The chart now circles 2025 in a similar position, with XRP trading just above the same moving average after another strong advance.
Steph writes that the setup “looks very dangerous for XRP,” implying that another failure at the 50-week SMA could repeat the earlier patterns.
The chart does not guarantee the same outcome, but it frames the weekly 50-SMA as a key line that previously separated bull phases from deeper drawdowns.
![XRP Pennant Targets 11% Rally as Weekly Signal Flashes image 2]()

Tatevik Avetisyan
Editor at Kriptoworld
LinkedIn | X (Twitter)
Tatevik Avetisyan is an editor at Kriptoworld who covers emerging crypto trends, blockchain innovation, and altcoin developments. She is passionate about breaking down complex stories for a global audience and making digital finance more accessible.
📅 Published: November 28, 2025 • 🕓 Last updated: November 28, 2025