Date: Sat, Dec 06, 2025 | 08:40 AM GMT
The broader cryptocurrency market is once again feeling downside pressure after a brief recovery earlier this week. Ethereum (ETH) tapped the high of $3,248 on Dec 04, but has since retraced back to $3,018, losing over 4% in the last 24 hours.
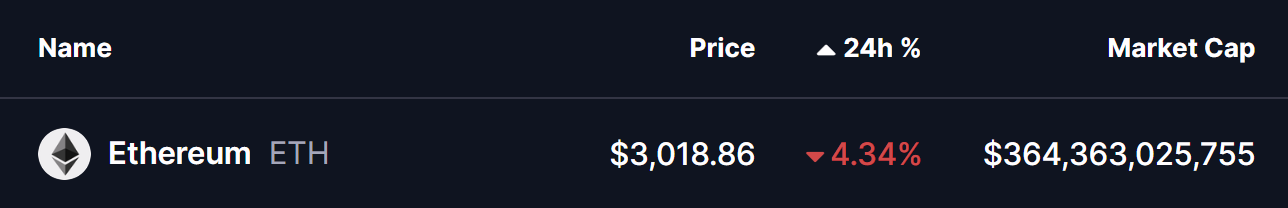 Source: Coinmarketcap
While sentiment is temporarily leaning bearish, the price chart is quietly flashing a structural pattern that could hint at a potential upside reversal — one that strikingly mirrors Solana’s (SOL) bullish breakout setup from late 2024.
ETH Mirrors SOL’s Fractal Setup
A comparative look between ETH and SOL on the 4H chart shows a nearly identical sequence of structure, pullback, and retest behavior — suggesting that ETH may be preparing for a similar breakout continuation.
In SOL’s October 2024 fractal, the asset completed a double bottom, broke above its neckline resistance, retested the same neckline area aligned with the 50 MA, and then fired upward with a sharp 23% rally.
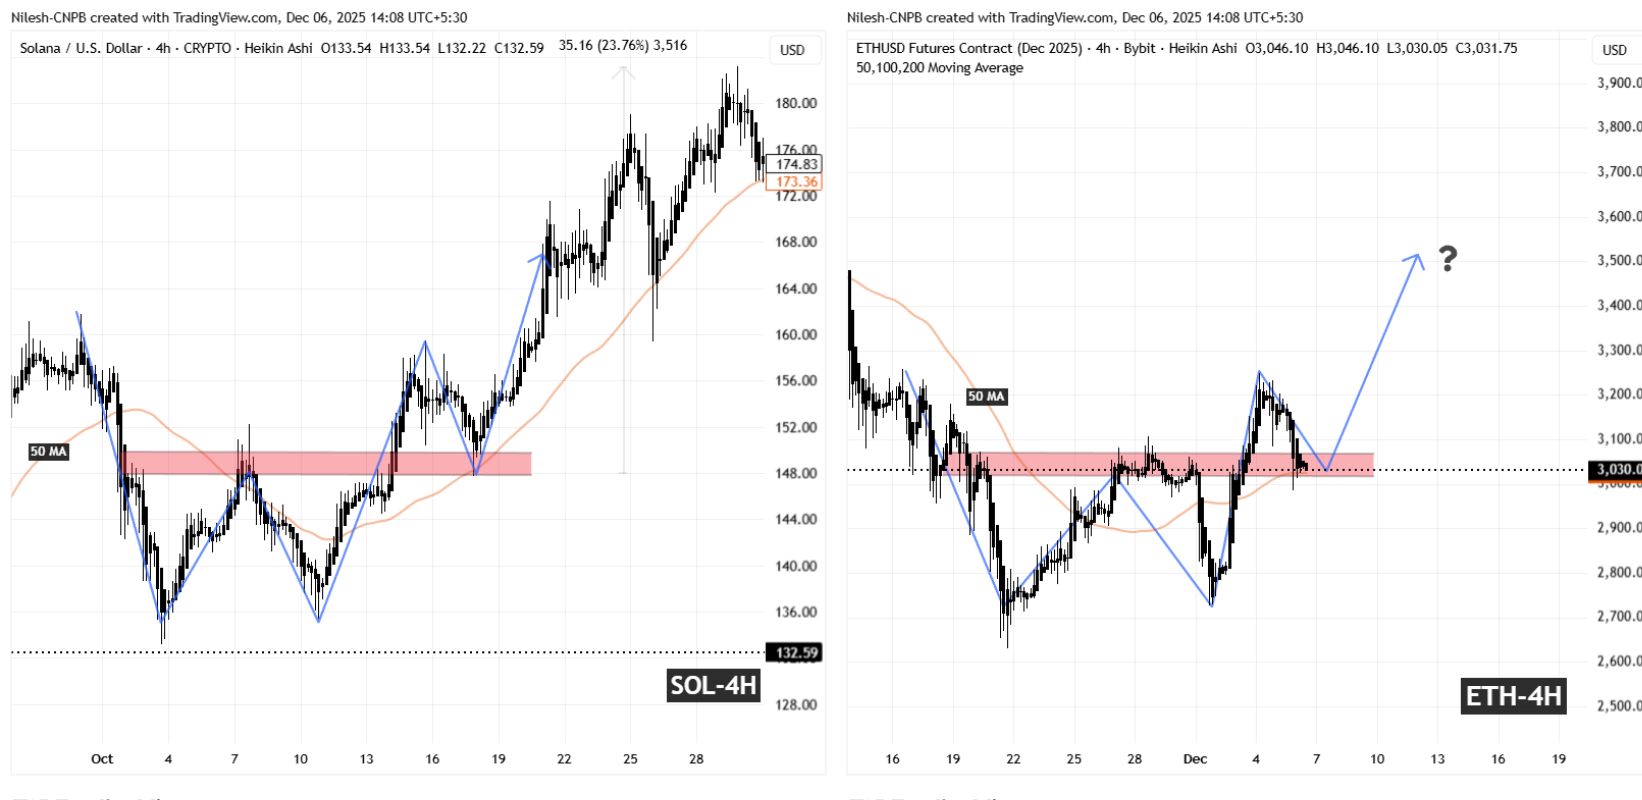 SOL and ETH Fractal Chart/Coinsprobe (Source: Tradingview)
ETH is now exhibiting the same technical roadmap.
The asset recently broke above its double-bottom neckline zone at $3,000–$3,070, and is currently pulling back to retest that exact region. Importantly, this retest aligns precisely with the 50 MA support at $3,024, forming the same bullish confluence that triggered SOL’s strong continuation rally.
What’s Next for ETH?
If the current support cluster at $3,000–$3,070 holds and buyers defend the neckline zone, ETH could respond with a breakout continuation toward $3,500, closely mirroring SOL’s earlier upside extension.
However, if price slips and closes decisively below the $3,000 level, the fractal symmetry begins to weaken, potentially delaying upside and opening another corrective leg before any renewed attempt higher.
For now, the structure remains intact — and if Ethereum continues to shadow Solana’s historic breakout rhythm, a rebound could be closer than the market currently expects.