
- The Bitcoin price is at $92,200 in intraday trading on December 8, 2025.
- The benchmark digital asset is slightly bullish after bulls suffered a negative tilt in November.
- While weakness continues to linger as price hovers near the $90,000 mark, eyes are on the US Federal Reserve.
Bitcoin is showing signs of bullish reversal, with the latest upside momentum pushing the BTC price above $92,000 as risk assets gain ahead of a key Federal Reserve meeting.
As stock futures rose ahead of Wall Street’s open on Monday, Bitcoin mirrored the move with a 3% rise to $92,220.
The technical picture shows a classic ascending triangle formation on the daily chart, suggesting a possible sharp upside move toward $95,000 and $100,000 in the coming days.
Meanwhile, Ethereum is currently above $3,100 and could eye $3,500-$4,000 area .
Across altcoins, the BNB price could jump above $1,000 after Binance’s major regulatory milestone .
Bitcoin gains amid Fed rate cut anticipation
On Monday, US stock futures recorded gains as investors weighed the Federal Reserve’s policy meeting on Tuesday and Wednesday.
While modest, the uptick aligns with major gauges’ consecutive weekly gains.
BTC has also tapped green in the past week after falling to lows of $80,000 amid a tough November.
Investors expect the Fed to cut interest rates, and markets are upbeat.
The tame personal consumption expenditures (PCE) price index helped this outlook.
PCE is a key US inflation reading, and its print adds to the confidence that Fed Chair Jerome Powell will announce a rate cut this week.
Could Bitcoin bulls push for $100k?
Bitcoin experienced notable price swings over the weekend as the price plunged below the $90,000 mark before recovering swiftly.
The initial dip saw a cascade of long-position liquidations that exceeded $170 million, but as shorts piled in, BTC flipped higher and caught over-leveraged bears off guard.
QCP Group analysts shared this price movement detail via X on Monday.
Asia Colour – 8 Dec 25
1/ $BTC swung between 88k–92k over the weekend while $ETH saw sharp two-way moves, reflecting how thin year-end liquidity has become. Liquidations were modest, highlighting how positioning has continued to unwind.
— QCP (@QCPgroup) December 8, 2025
As of writing, BTC is showing signs of steady accumulation above $92k.
“Focus shifts to Wednesday’s FOMC,” QCP analysts noted. “A 25bp cut is priced, but balance-sheet guidance will guide risk. With $BTC still stuck between 84k and 100k, a break on either side could define the next major trend,” they added.
Support is from both institutional dip-buyers and retail accumulation, and a break in the $95,000-$105,000 region is likely.
Part of this is down to an ascending triangle pattern that has been developing on Bitcoin’s daily chart since mid-November.
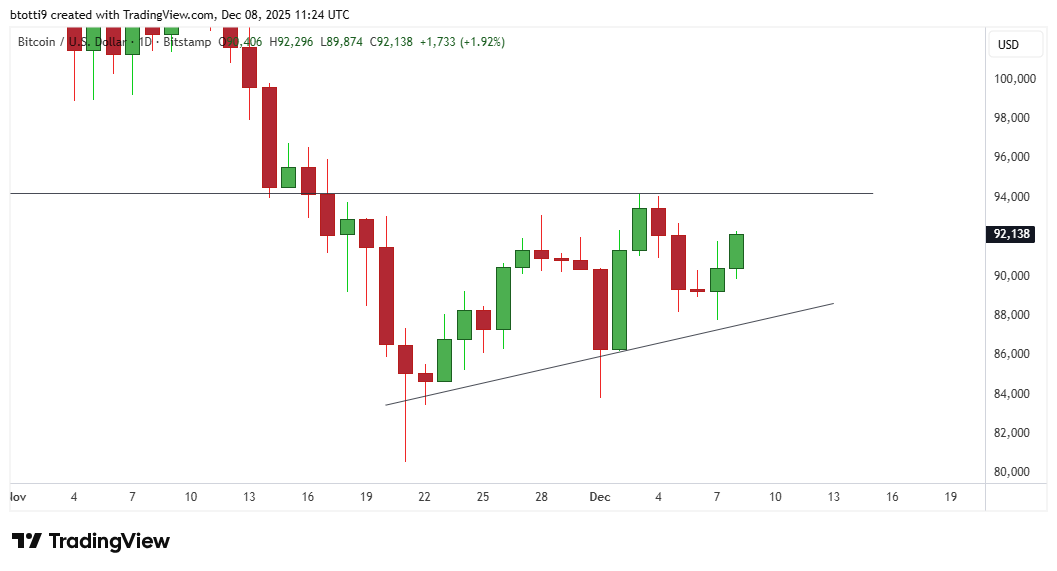 Bitcoin price chart by TradingView
The pattern, accompanied by contracting volatility and rising spot demand, offers a bullish outlook.
In Bitcoin’s case, a decisive close above the $92k level will bring $95k into play and the $100,000–$101,500 resistance zone.
Renewed macro liquidity signals, buoyed by a positive Federal Reserve policy, will aid further technical breakout.