XRP Mirrors 2016 Trend That Led To 69% Crash Before 110,000% Rally

XRP has struggled to create any upside traction over the past few days, with the price rejecting above $2.15 in the middle of the week and now back to lingering just above the $2 level.
A new long-term technical comparison shared by crypto analyst ChartNerd places XRP’s price behavior since its July all-time high of $3.65 into an interesting context, implying that what XRP is doing now resembles a phase from its 2016 market cycle that points to an incoming huge rally.
Repeating 2016 Rejection And ABC Crash Structure
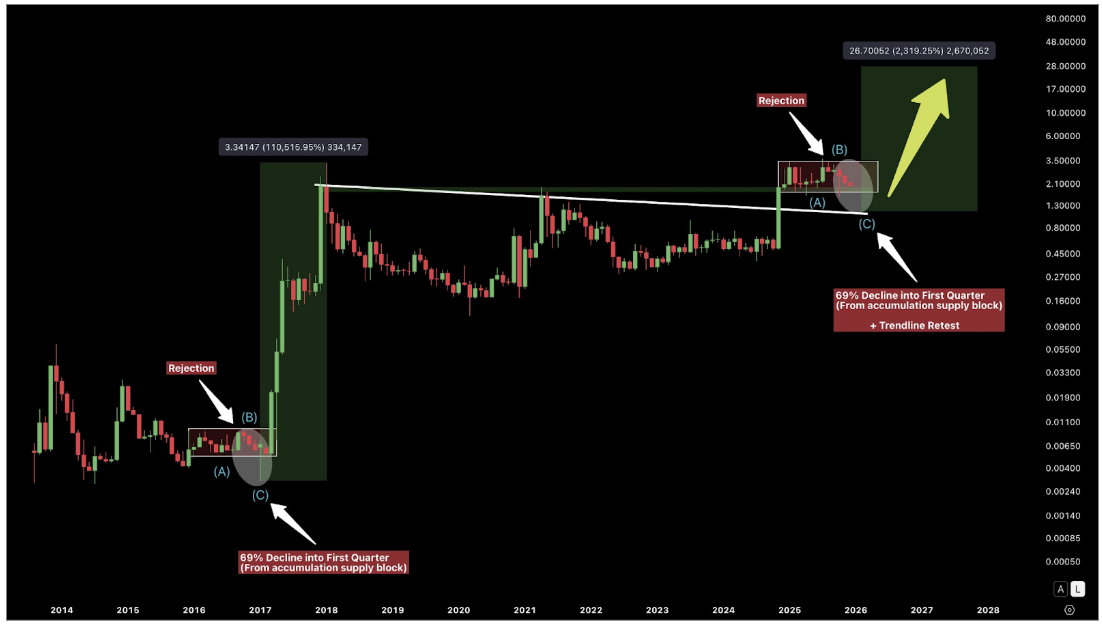
According to crypto analyst ChartNerd, XRP’s current structure matches a similar price action that unfolded in late 2016. when price rejected an accumulation supply block and rolled into an ABC corrective move. That correction ultimately produced a 69% flash-wick decline that extended into the first quarter of 2017.
The drop was severe and unfolded over several months, eventually pushing XRP to as low as $0.00240, but it eventually represented the end of the correction rather than the end of the bullish cycle.
The chart accompanying the analysis, which is shown below, highlights a similar rejection pattern forming now. This pattern is based on how the XRP price rejected at its most recent all-time high in July. Since then, the monthly price chart has been printing consecutive red candles, with monthly closes consistently below opens.
At the time of writing, XRP is about a 44% correction from this all-time high. This means a 69% correction is yet to play out in its entirety. Therefore, if history repeats, a full 69% ABC-style move from the all-time high would drag XRP back below $1 and as low as $0.8. This move is expected to play out into the first quarter of 2026.
XRP Price Chart. Source: @ChartNerdTA
Potential Drop Could Be A Set-Up For A Much Larger Rally
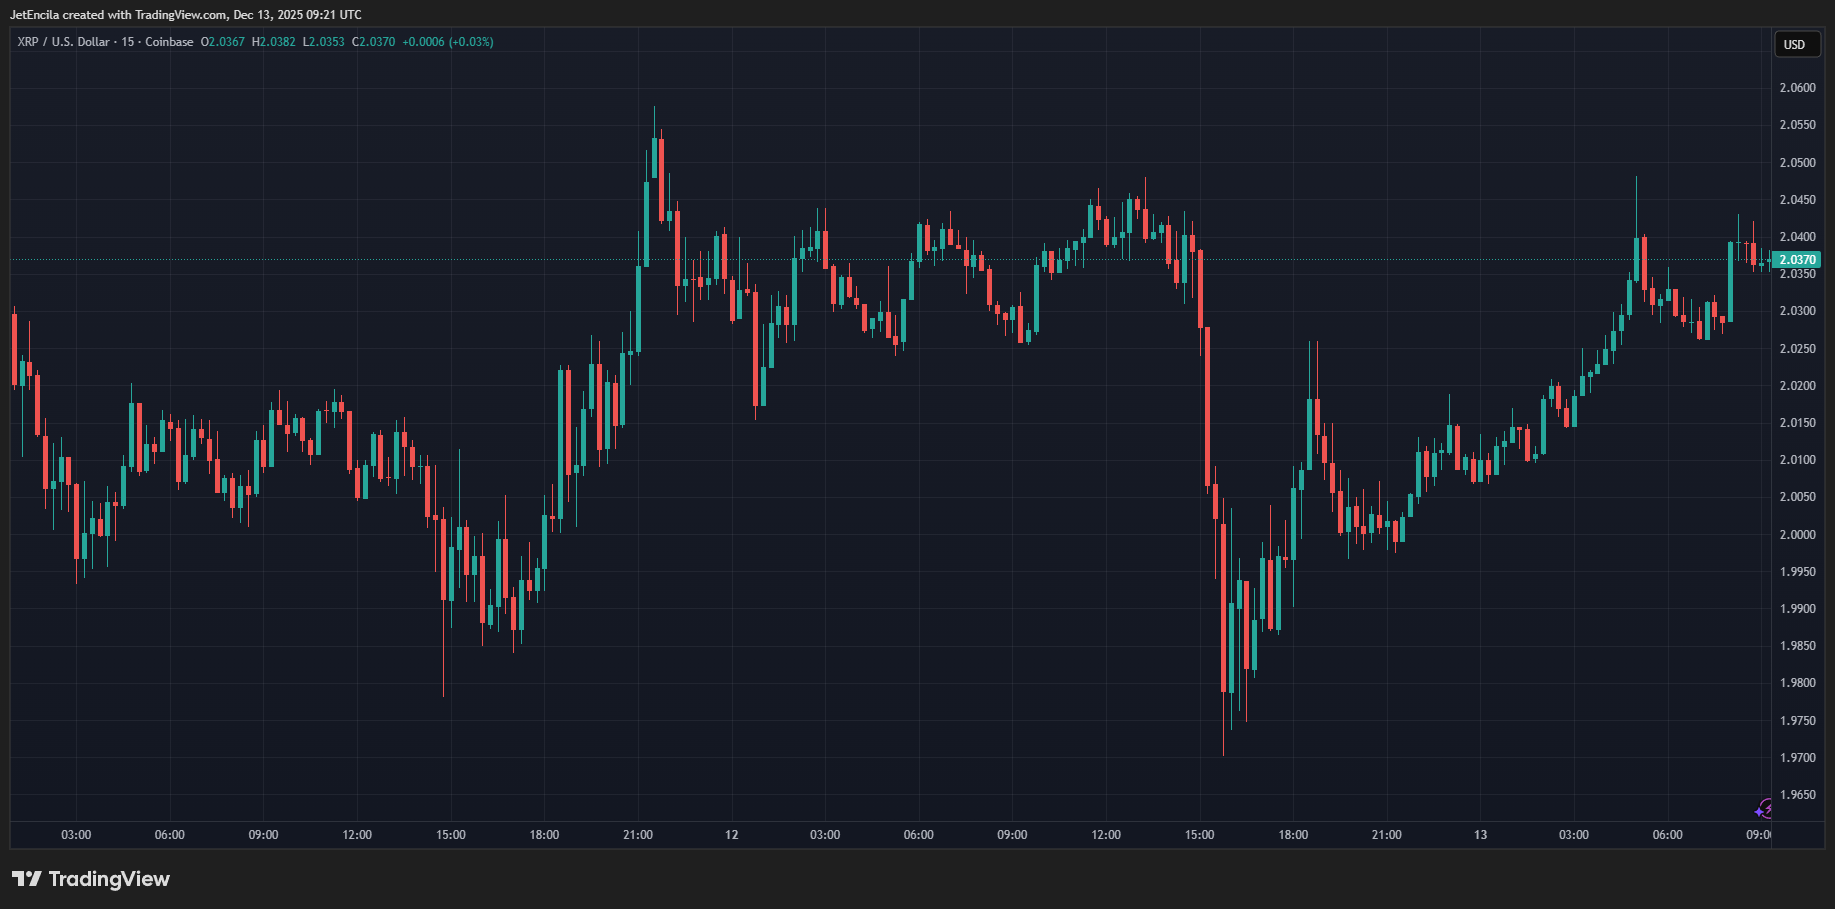
XRP is currently trading at $2.04. Therefore, a deeper pullback below $1 will translate to a 51% decrease from the current price action. The idea of a deeper pullback from $2 is tough to imagine, especially given the inflows into Spot XRP ETFs. In fact, a pullback of that magnitude could test conviction across the market and cause many bullish traders to step aside.
However, the technical analysis frames it as a structural reset rather than anything else. In 2017, the post-crash consolidation laid the groundwork for one of XRP’s most explosive rallies on record, ultimately delivering gains in excess of 110,000%.
If this sequence plays out as expected, then the real bullish opportunity would develop later in 2026. From that reset zone, the chart projects a long-term advance to the 1.618 Fibonacci extension, placing a potential upside target around $27. The visual projection in the chart above shows a clean multi-month expansion zone that delivers a 2,300% gain after the corrective phase.
Featured image from Unsplash, chart from TradingView
Disclaimer: The content of this article solely reflects the author's opinion and does not represent the platform in any capacity. This article is not intended to serve as a reference for making investment decisions.
You may also like
Litecoin Holds $100 Base as Chart Signals 2025 Recovery

Stablecoins Gain Popularity in Venezuela as Hyperinflation and Sanctions Persist

Fed Rate Cut Triggers Mixed Crypto ETF Performance as Bitcoin, XRP ETFs Post Inflows, Ether Outflows
Bitcoin To Retest $85,000 Mark In Coming Days – Here’s Why