
Ethereum price forms an ABCD correction pattern, putting $2,500 in focus

Ethereum price is forming a textbook ABCD corrective pattern after rejecting key resistance, with downside risk building toward the $2,500 high-time-frame support zone.
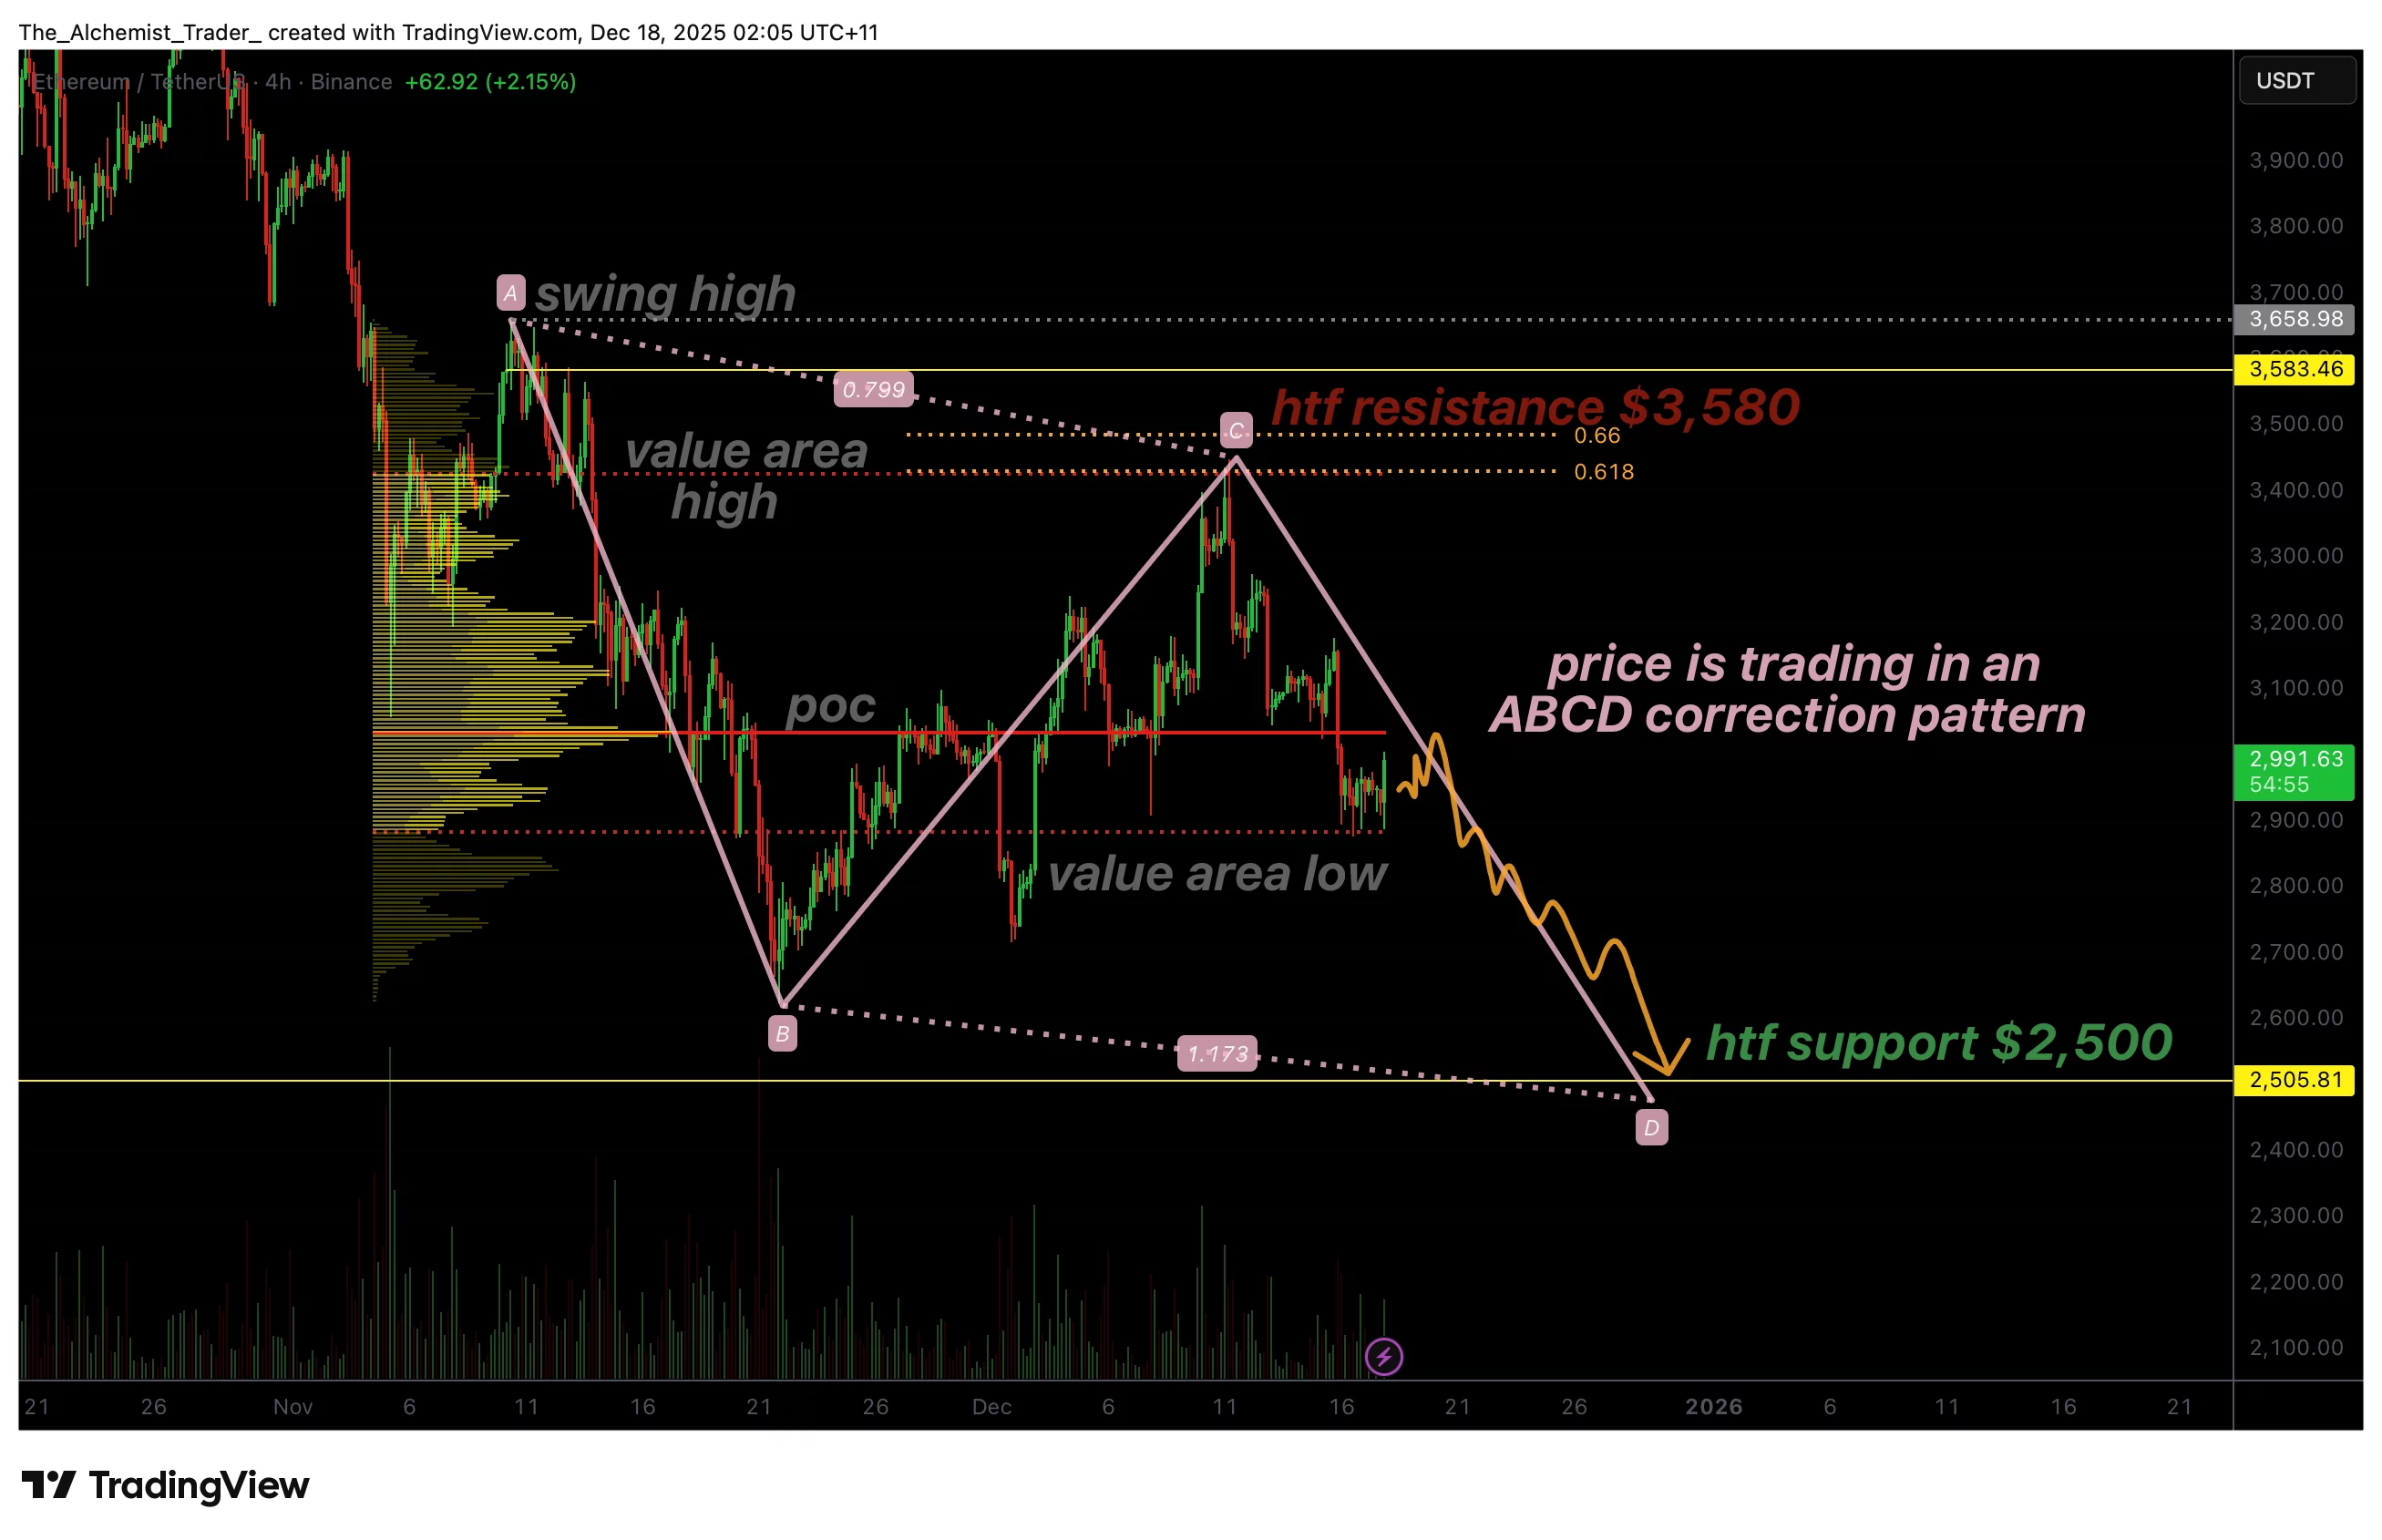
- ETH rejects the Value Area High and 0.618 Fibonacci resistance.
- Price rotates toward POC and Value Area Low within an ABCD pattern.
- $2,500 is key high-time-frame support for a potential macro bottom.
Ethereum (ETH) price continues to trade within a corrective structure, with price action developing a well-defined ABCD correction pattern. After rejecting primary resistance levels, ETH is now rotating lower toward key volume-based support.
This behavior suggests that the market remains in a broader correction rather than in a renewed bullish trend. With the pattern pointing toward the $2,500 region, traders are closely watching whether this level will act as a macro support capable of stabilizing price and setting the stage for a potential rotation higher.
Ethereum price key technical points
- Ethereum forms an ABCD corrective pattern, signaling a measured downside move.
- Price rejected from the Value Area High and 0.618 Fibonacci, confirming bearish pressure.
- $2,500 stands out as major high-time-frame support, critical for any macro bottom.
 ETHUSDT (4H) Chart, Source:
TradingView
ETHUSDT (4H) Chart, Source:
TradingView
Ethereum’s recent price action reflects a textbook corrective environment. After failing to sustain bullish momentum, ETH rejected sharply from the Value Area High (VAH), which coincided precisely with the 0.618 Fibonacci retracement. This rejection occurred almost to the dollar, reinforcing the technical significance of the level and confirming it as strong resistance.
Following the rejection, price rotated lower toward the Point of Control (POC) and the Value Area Low (VAL), a move consistent with Market Auction Theory and corrective price behavior. This rotation is now developing into a precise ABCD correction, in which price moves symmetrically from point A to B, retraces to C, and then extends toward point D to complete the structure.
The critical concern for bulls is the current support region around the Point of Control (POC) and the Value Area Low (VAL). This zone represents short-term equilibrium.
If Ethereum loses this area on a closing basis, it would signal acceptance below value and open the probability of continuation toward the $2,500 region, which aligns with the completion of the ABCD pattern, even as BitMine increases its Ethereum reserves, citing AI-driven upside toward $20K, highlighting the contrast between long-term narratives and near-term technical risk.
It is also important to note that corrective patterns like ABCD structures often allow for lower-time-frame bounces along the way. These bounces, however, should be viewed as countertrend moves unless accompanied by strong volume and a reclaim of key resistance levels. Without that confirmation, rallies are more likely to remain corrective rather than impulsive.
If Ethereum does reach the $2,500 region and successfully holds it, the market could begin forming a macro higher low. Such a development would significantly improve the bullish outlook and open the door for a rotation back toward the $3,580 high-time-frame resistance, which represents the next major upside objective, especially as Dec. 20 options expiry puts Bitcoin and Ethereum max pain levels to the test, potentially acting as a volatility catalyst.
However, until that support is tested and defended, Ethereum remains in a corrective phase. Market structure continues to show lower highs, and price has yet to reclaim key volume levels that would signal a shift back to bullish control.
What to expect in the coming price action
Ethereum is likely to remain volatile within its corrective structure in the near term. If price loses the POC and VAL, a move toward $2,500 becomes increasingly likely to complete the ABCD correction. A strong reaction from that level could set the stage for a rotation back toward $3,580, while failure to hold would delay any meaningful bullish reversal.
Disclaimer: The content of this article solely reflects the author's opinion and does not represent the platform in any capacity. This article is not intended to serve as a reference for making investment decisions.
You may also like
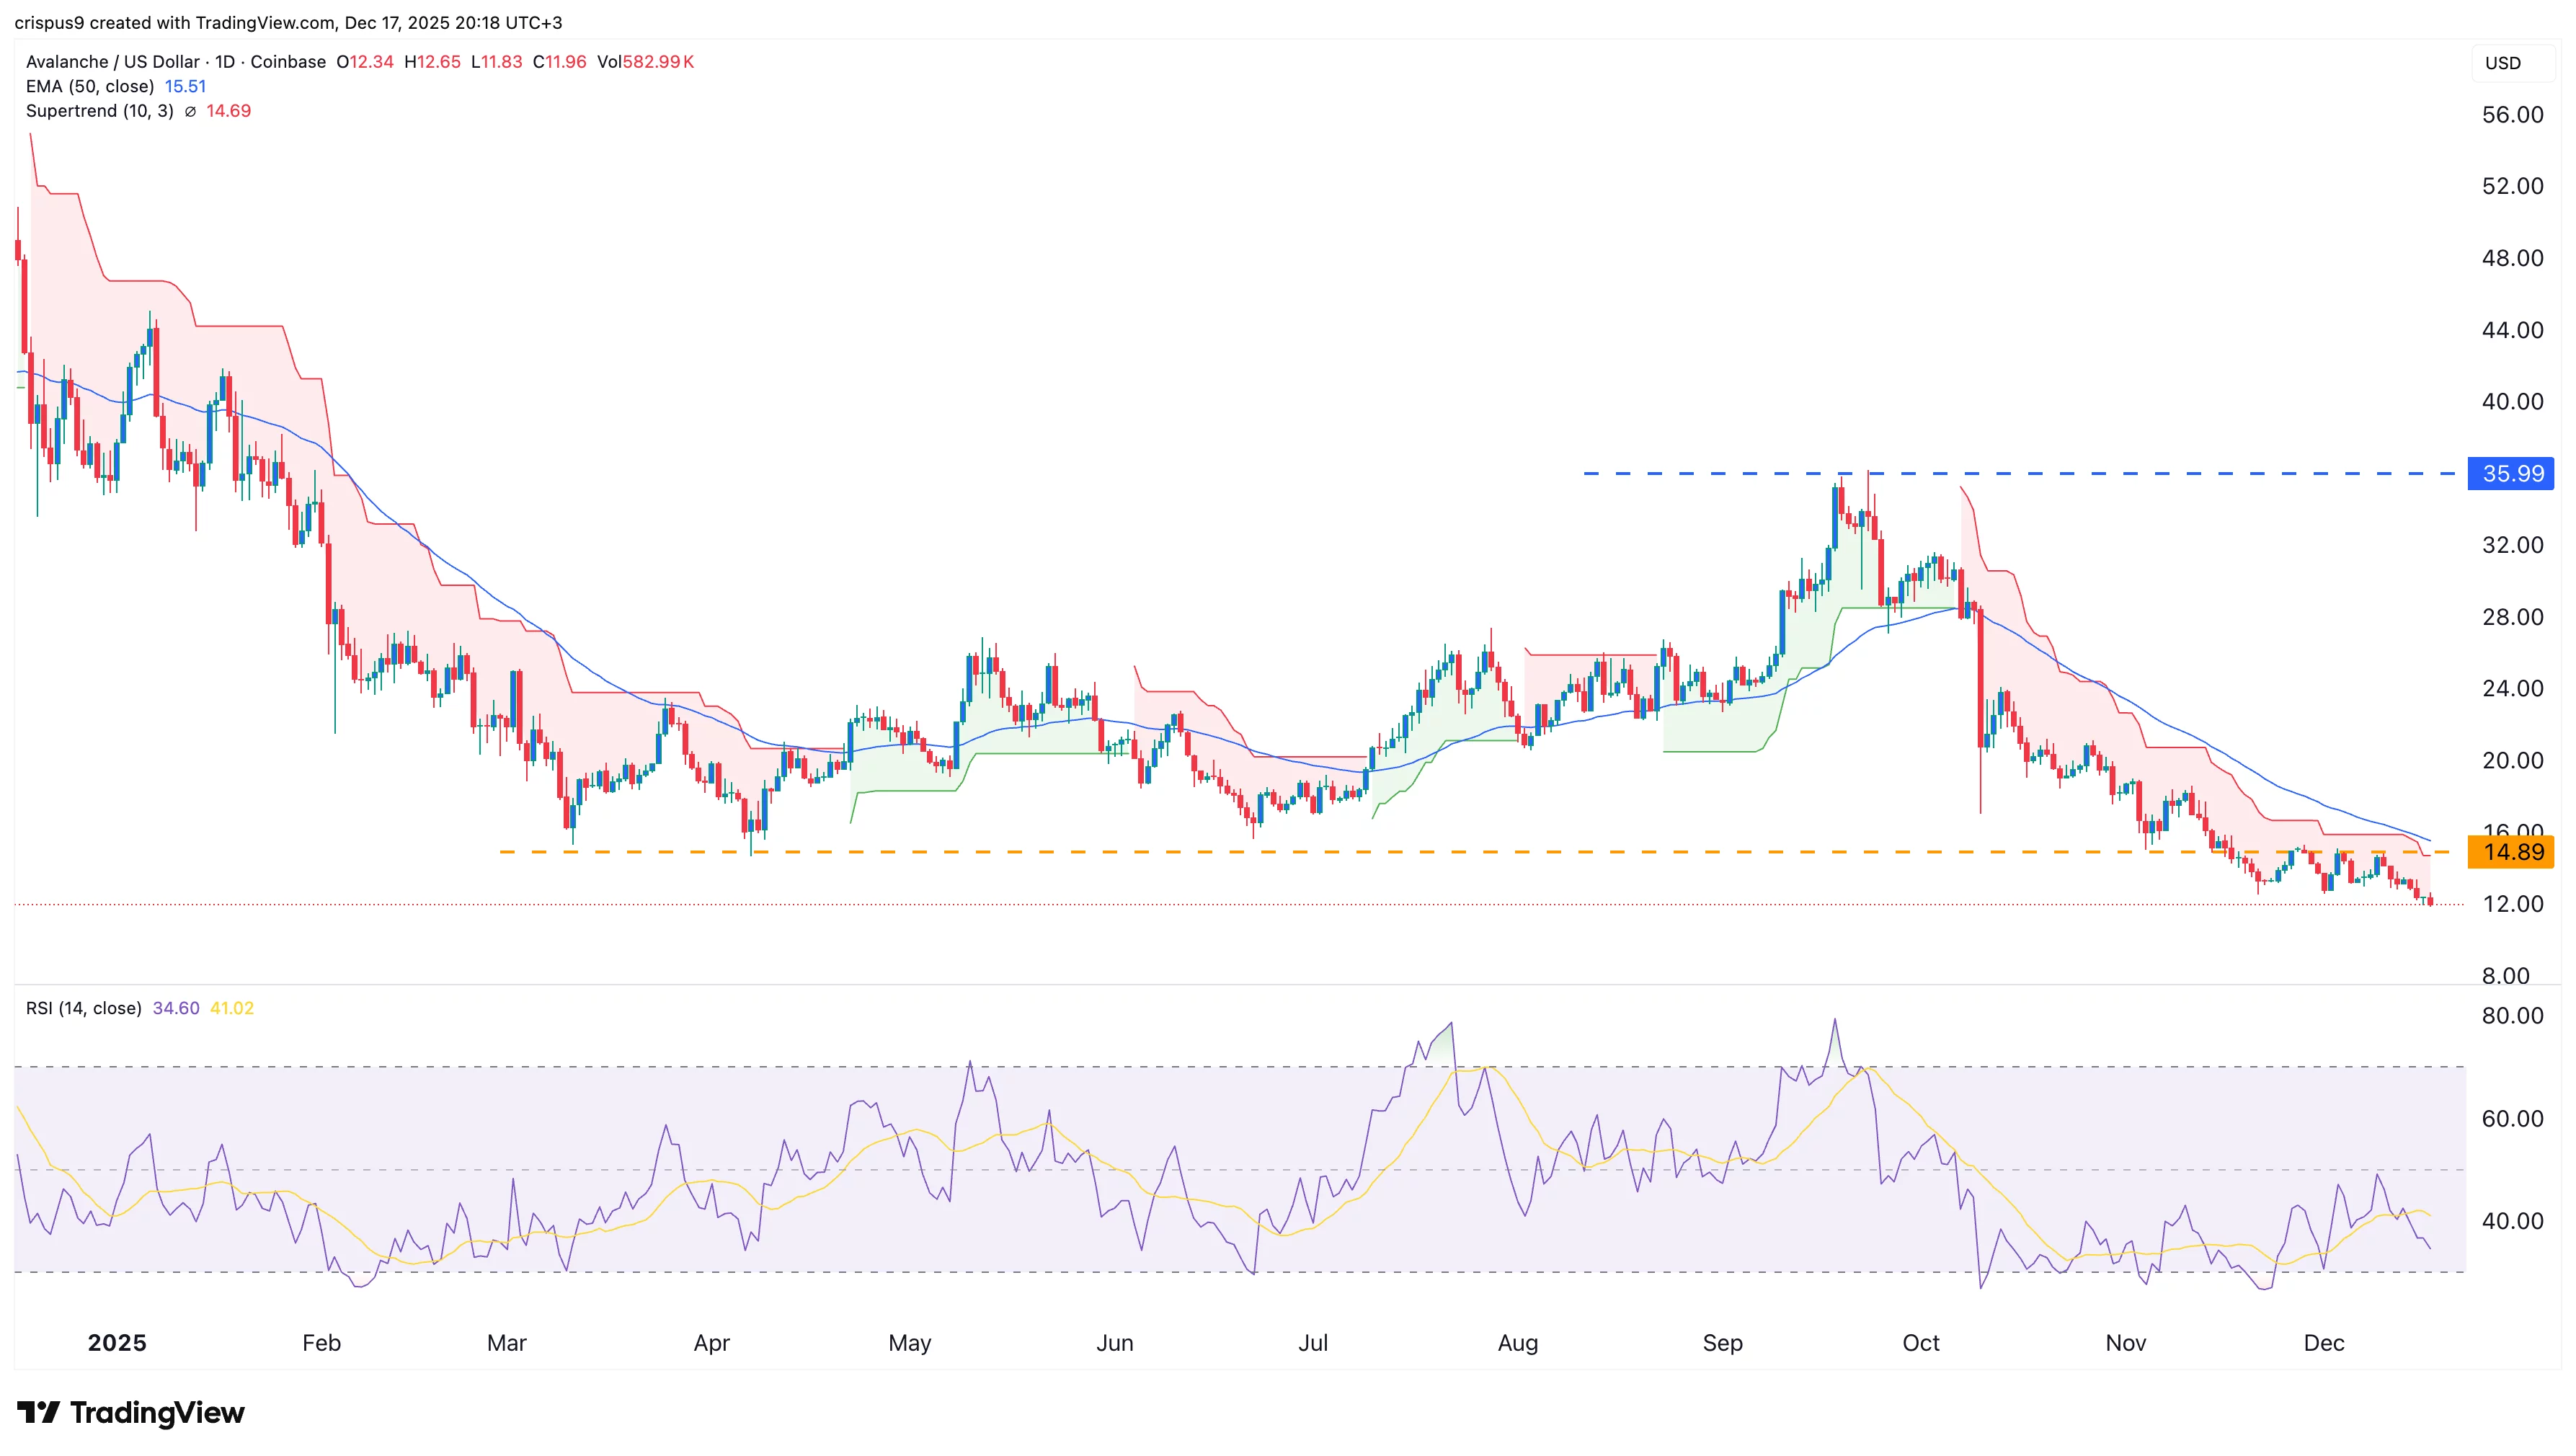
AVAX price analysis as Spark TVL on Avalanche hits $210m in a week
Can Solana’s Brazil ETP Narrative Spark a Price Breakout? Charts Hold the Clue
Ripple and SBI are redefining XRP DeFi, targeting a billion-dollar yield stream that ignores on-chain mechanics
XRP Consolidates at $1.99 as Trading Range Levels Remain Intact