
Bitcoin Added And Lost Nearly $100 Billion In Hours, What Just Happened?

By:BeInCrypto
Bitcoin experienced an extreme bout of volatility on December 17, surging more than $3,000 in under an hour before reversing sharply and falling back toward $86,000. The violent swing did not follow any major news. Instead, market data shows the move was driven by leverage, positioning, and fragile liquidity conditions. A Short Squeeze Pushed Bitcoin Higher The initial rally began as Bitcoin pushed toward the $90,000 level, a major psychological and technical resistance zone. Bitcoin Price Wild Swing on December 17. Source: CoinGecko Liquidation data shows a dense cluster of leveraged short positions positioned above that level. When price moved higher, those shorts were forced to close. That process requires buying Bitcoin, which pushed prices up even faster. Roughly $120 million in short positions were liquidated during the spike. This created a classic short squeeze, where forced buying accelerates the move beyond what normal spot demand would justify. Crypto Market Liquidations On December 17. Source: Coinglass At this stage, the move looked strong. But the structure underneath it was weak. The Rally Flipped Into A Long Liquidation Cascade As Bitcoin briefly reclaimed $90,000, new traders entered the market chasing momentum. Many of those traders opened leveraged long positions, betting the breakout would hold. However, the rally lacked sustained spot buying and quickly stalled. When the price began to fall, those long positions became vulnerable. Once key support levels broke, exchanges automatically liquidated those positions. More than $200 million in long liquidations followed, overwhelming the market. Whoever is left We need to know what happened on October 10It's VERY apparent that the market broke that day and nothing has been the same since We haven't seen Bitcoin or Alts trade like this since 2018We need answers pic.twitter.com/jXe7jwd7RA EllioTrades (@elliotrades) December 17, 2025 This second wave explains why the drop was faster and deeper than the initial rise. Within hours, Bitcoin had fallen back toward $86,000, erasing most of the gains. Positioning Data Shows A Fragile Market Setup Trader positioning data from Binance and OKX helps explain why the move was so violent. On Binance, the number of top trader accounts leaning long rose sharply ahead of the spike. However, position-size data showed less conviction, suggesting many traders were long but not heavily sized. Bitcoin Long/Short Ratio on Binance Futures. Source: Coinglass On OKX, position-based ratios shifted aggressively after the volatility. That suggests larger traders repositioned quickly, either buying the dip or adjusting hedges as liquidations played out. This combination crowded positioning, mixed conviction, and heavy leverage creates a market that can move violently in both directions with little warning. Bitcoin Long/Short Ratio on OKX. Source: Coinglass Did Market Makers Or Whales Manipulate The Move? On-chain data showed market makers such as Wintermute moving Bitcoin between exchanges during the volatility. Those transfers coincided with the price swings but do not prove manipulation. Market makers routinely rebalance inventory during periods of stress. Deposits to exchanges can indicate hedging, margin management, or liquidity provision, not necessarily selling to crash prices. Importantly, the entire move can be explained by known market mechanics: liquidation clusters, leverage, and thin order books. There is no clear evidence of coordinated manipulation. Wintermute Heavily Repositioning Bitcoin Across Centralized Exchanges. Source: Arkham What This Means For Bitcoin Going Forward This episode highlights a key risk in todays Bitcoin market. Leverage remains elevated. Liquidity thins quickly during fast moves. When price approaches key levels, forced liquidations can dominate price action. Bitcoins fundamentals did not change during those hours. The swing reflected market structure fragility, not a shift in long-term value. 🚨 BITCOIN IS BEING MANIPULATED, AND I HAVE SOLID PROOF!!!Everyones talking about how Bitcoin went up $3,000 and then down $4,000 in minutes.Everyones posting about itbut nobody seems to understand what actually happened.You need to look at the flows, not the chart. pic.twitter.com/IHCXtx3sUF NoLimit (@NoLimitGains) December 17, 2025 Until leverage resets and positioning becomes healthier, similar sharp moves remain possible. In this case, Bitcoin did not rally and crash because of news. It moved because leverage turned price against itself.
0
0
Disclaimer: The content of this article solely reflects the author's opinion and does not represent the platform in any capacity. This article is not intended to serve as a reference for making investment decisions.
PoolX: Earn new token airdrops
Lock your assets and earn 10%+ APR
Lock now!
You may also like
Japan’s Bond Yields Hit 1.98%: BOJ Rate Shift Impacts Gold, Silver, and Bitcoin
BeInCrypto•2025/12/18 09:45
XRP bulls get new on-ramp as DWP brings algo trading to IRAs and retirement plans
Crypto.News•2025/12/18 09:36

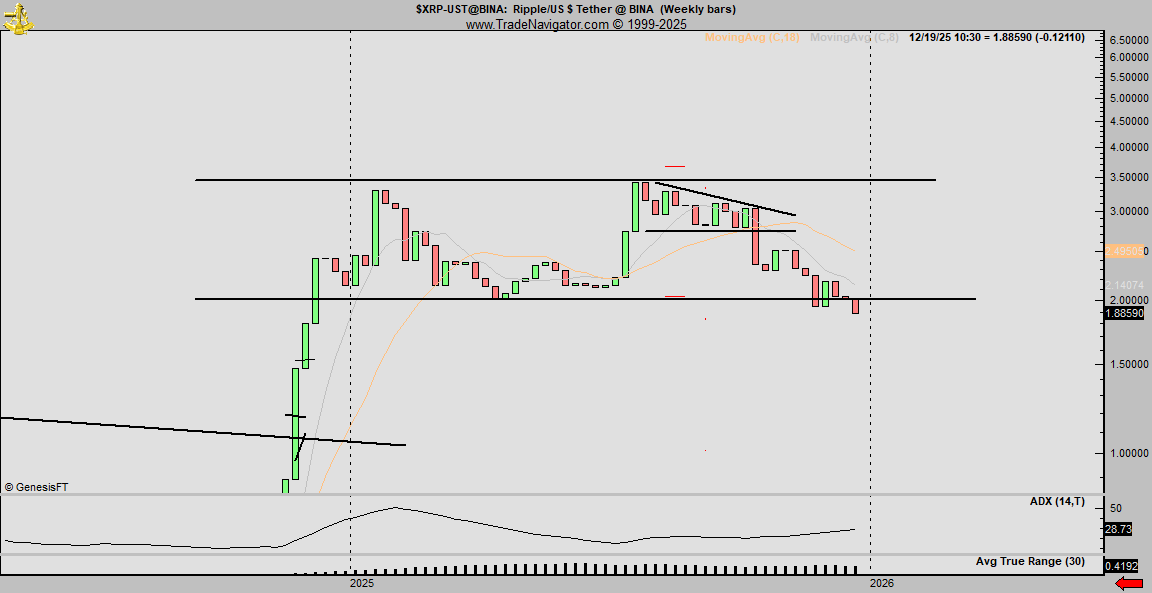
XRP Risks Double-Top Crash Toward $0.40, Peter Brandt Warns
Newsbtc•2025/12/18 09:33
Trending news
MoreCrypto prices
MoreBitcoin
BTC
$86,980.16
+0.82%
Ethereum
ETH
$2,844.81
-2.59%
Tether USDt
USDT
$0.9995
-0.01%
BNB
BNB
$836.54
-3.06%
XRP
XRP
$1.86
-2.29%
USDC
USDC
$0.9999
+0.00%
Solana
SOL
$123.07
-2.52%
TRON
TRX
$0.2773
-0.65%
Dogecoin
DOGE
$0.1252
-3.50%
Cardano
ADA
$0.3627
-3.92%
How to buy BTC
Bitget lists BTC – Buy or sell BTC quickly on Bitget!
Trade now
Become a trader now?A welcome pack worth 6200 USDT for new users!
Sign up now