Bitget App
Trade smarter
Buy cryptoMarketsTradeFuturesEarnSquareMore

TS to ZAR Converter and calculator

TS/ZAR: 1 TS = 0.002235 ZAR. The price of converting 1 Team Shares (TS) to South African rand (ZAR) is 0.002235 ZAR today.
TS
TS
ZAR
Last updated as of 2023/09/01 02:23:05 (UTC+0)Refreshrefresh
Want to display this on your website?
Bitget converter provides TS to ZAR real-time exchange rates, making it easy to convert Team Shares (TS) to South African rand (ZAR). The conversion result is based on real-time data. The conversion result shows that 1 TS is currently valued at 0.002235 ZAR. Since crypto prices can change rapidly, we recommend checking back for the conversion result.
1 TS is currently valued at 0.002235 ZAR, which means buying 5 TS would cost 0.01117 ZAR. Similarly, R1 ZAR can be converted to 447.49 TS, and R50 ZAR can be converted to 2,237.46 TS, excluding any platform or gas fees.

Convert TS to ZAR

Convert ZAR to TS

Team Shares
South African rand
1 TS
0.002235  ZAR
Exchange 1 TS for 0.002235 ZAR
2 TS
0.004469  ZAR
Exchange 2 TS for 0.004469 ZAR
5 TS
0.01117  ZAR
Exchange 5 TS for 0.01117 ZAR
10 TS
0.02235  ZAR
Exchange 10 TS for 0.02235 ZAR
20 TS
0.04469  ZAR
Exchange 20 TS for 0.04469 ZAR
50 TS
0.1117  ZAR
Exchange 50 TS for 0.1117 ZAR
100 TS
0.2235  ZAR
Exchange 100 TS for 0.2235 ZAR
200 TS
0.4469  ZAR
Exchange 200 TS for 0.4469 ZAR
500 TS
1.12  ZAR
Exchange 500 TS for 1.12 ZAR
1000 TS
2.23  ZAR
Exchange 1000 TS for 2.23 ZAR
5000 TS
11.17  ZAR
Exchange 5000 TS for 11.17 ZAR
10000 TS
22.35  ZAR
Exchange 10000 TS for 22.35 ZAR
In the table above, you'll find a comprehensive TS to ZAR converter that shows the value of Team Shares in South African rand across commonly used conversion amounts. The list covers conversions from 1 TS to ZAR, all the way up to 10000 TS, providing a clear view of their respective values.
South African rand
Team Shares
1 ZAR
447.49 TS
Exchange 1 ZAR for 447.49 TS
10 ZAR
4,474.92 TS
Exchange 10 ZAR for 4,474.92 TS
50 ZAR
22,374.58 TS
Exchange 50 ZAR for 22,374.58 TS
100 ZAR
44,749.16 TS
Exchange 100 ZAR for 44,749.16 TS
200 ZAR
89,498.31 TS
Exchange 200 ZAR for 89,498.31 TS
500 ZAR
223,745.78 TS
Exchange 500 ZAR for 223,745.78 TS
1000 ZAR
447,491.56 TS
Exchange 1000 ZAR for 447,491.56 TS
2000 ZAR
894,983.12 TS
Exchange 2000 ZAR for 894,983.12 TS
5000 ZAR
2,237,457.8 TS
Exchange 5000 ZAR for 2,237,457.8 TS
10000 ZAR
4,474,915.6 TS
Exchange 10000 ZAR for 4,474,915.6 TS
50000 ZAR
22,374,578.02 TS
Exchange 50000 ZAR for 22,374,578.02 TS
100000 ZAR
44,749,156.03 TS
Exchange 100000 ZAR for 44,749,156.03 TS
In the table above, you'll find a comprehensive ZAR to TS converter that shows the value of South African rand in Team Shares across commonly used conversion amounts. The list covers conversions from 1 ZAR to TS, all the way up to 100000 ZAR, providing a clear view of their respective values.

TS to ZAR chart

TS/ZAR: 1 TS = 0.002235 ZAR; 2025/11/12 08:06:22
In the past 1D, Team Shares has changed +1.63% to ZAR. Based on the trend and price charts, Team Shares(TS) has changed +1.63% to ZAR while South African rand(ZAR) has changed % to TS in the last 24 hours.
1D7D1M3M1YAll

TS to ZAR conversion data: Volatility and price changes of Team Shares in ZAR

The highest Team Shares price in ZAR over the past 7 days was -- ZAR while the lowest Team Shares price in ZAR over the past 7 days was -- ZAR. The relative change between the highs and lows in Team Shares price in ZAR over the last 7 days indicates a volatility of %. You can view additional volatility data and TS to ZAR prices for the past 24 hours, 30 days, and 90 days in the table above.
Last 24 hours Last 7 days Last 30 days Last 90 days
High
0.002424 ZAR
-- ZAR
-- ZAR
-- ZAR
Low
0.001183 ZAR
-- ZAR
-- ZAR
-- ZAR
Average
0 ZAR
0 ZAR
0 ZAR
0 ZAR
Volatility
%
%
%
%
Change
+1.63%
--
--
--

Buy

Sell

Buy TS (or USDT) for ZAR (South African Rand) offers
Bitget P2P trading does not currently support direct buying of TS with ZAR. However, you can buy USDT in Bitget P2P trading first, and then buy TS with USDT via Bitget spot market.
Merchants (trades/completion rate)PriceAmount/limit
Low to high
Payment methods
Zero fees
Action
No matching ads found.

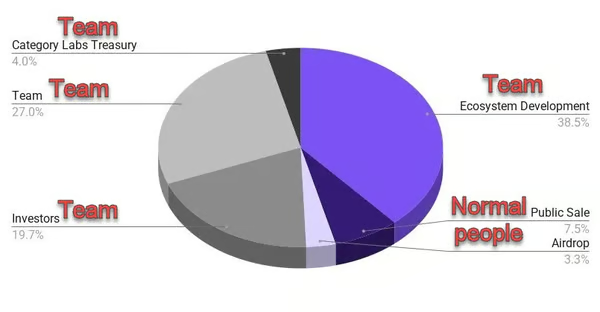
Team Shares information

TS to ZAR market statistics

TS/ZAR:
R0.002235
TS 24h volume:
R231,413,379.12
TS market cap:
R2,234,672.59
TS circulating supply:
1000.00M TS

Current TS to ZAR exchange rate

Team Shares to South African rand is falling this week.
Team Shares's current market price is R0.002235 per TS, with a total market cap of R2,234,672.59 ZAR based on a circulating supply of 999,997,100 TS. The trading volume of Team Shares has changed by --% (R-- ZAR) in the last 24 hours. Last trading day, TS's trading volume was R--.

More info about Team Shares on Bitget

South African rand information

About the South African Rand (ZAR)

What Is the South African Rand (ZAR)?

The South African Rand, designated as ZAR and symbolized as R, is the official currency of the Republic of South Africa. It is also recognized in the Common Monetary Area, shared with Lesotho, Namibia, and Eswatini, where it circulates alongside local currencies. The Rand is subdivided into 100 cents.

The South African Rand is issued by the South African Reserve Bank (SARB). The SARB is the central bank of South Africa and is responsible for the production and distribution of banknotes and coins in the country. It oversees the monetary policy and maintains financial stability in South Africa, playing a crucial role in the economy of the nation.

What Is the History of ZAR?

The Rand takes its name from the Witwatersrand, meaning "white waters' ridge" in Afrikaans, which is the location of Johannesburg and a major gold-mining area. Introduced in 1961 when South Africa became a republic, it replaced the South African pound at a rate of 2 Rand to 1 pound.

Notes and Coins of ZAR

South African coins are issued in denominations of 1, 2, 5, 10, 20, and 50 cents, and 1, 2, and 5 Rands. Banknotes are available in 10, 20, 50, 100, and 200 Rand denominations. Since 2012, banknotes have featured Nelson Mandela on the front and the "Big Five" wild animals on the back. Commemorative notes released in 2018 feature Mandela's images.

Exchange Rate History of ZAR

Initially, the Rand was strong, trading at 1.40 USD in its early years. However, due to inflation and international opposition to apartheid, its value declined. By 1985, it traded at 2 Rands per USD and continued to depreciate, reaching over 6 ZAR/USD by 1999 and nearly 14 ZAR/USD by 2001. After recovering to about 6-to-1 against the dollar by 2006, it faced another decline due to a slowdown in the mining industry and global economic factors. In 2016, it reached an all-time low of nearly 18 ZAR/USD.

What Is The Common Monetary Area?

The Common Monetary Area (CMA) is a monetary union in Southern Africa comprising South Africa, Namibia, Lesotho, and Eswatini. It facilitates the free movement of capital and services among these nations, with the South African Rand (ZAR) serving as the primary currency. Within this union, while each member country has its own currency, the Rand is also legal tender and the local currencies are pegged at par with the Rand. This arrangement ensures economic stability and fosters cooperation among the member states. The South African Reserve Bank plays a pivotal role in influencing the monetary policy across the CMA, thereby promoting a higher degree of economic integration and facilitating seamless trade and financial transactions across these national borders.

Is ZAR a Stable Currency?

The South African Rand (ZAR) has historically exhibited a degree of volatility, influenced by a combination of domestic challenges and global economic factors. Internally, issues such as political uncertainty, governance concerns, and high unemployment rates have impacted its stability, while externally, it remains sensitive to global market sentiments and fluctuations in commodity prices, notably gold, given South Africa's status as a major producer. Although there have been phases where the Rand demonstrated resilience, its nature as an emerging market currency often subjects it to rapid valuation shifts in response to both local and international events. This characteristic renders the Rand more volatile compared to currencies from more economically stable regions, leading to a general perception of it being less stable, especially when measured against major global currencies like the US Dollar.

Bitget crypto-to-fiat exchange data shows that the most popular Team Shares currency pair is the TS to ZAR, with for Team Shares's currency code being TS. Use our cryptocurrency calculator now to see how much your cryptocurrency can be exchanged for ZAR.

Popular conversions

popular info bitcoin
BTC to USD
1 BTC to 102733.63 USD
popular info ethereum
ETH to USD
1 ETH to 3436.00 USD
popular info ripple
XRP to USD
1 XRP to 2.39 USD
popular info solana
SOL to USD
1 SOL to 156.26 USD
popular info bitcoin
BTC to EUR
1 BTC to 88689.94 EUR
popular info bitcoin
BTC to GBP
1 BTC to 78180.29 GBP
popular info bitcoin
BTC to CAD
1 BTC to 143899.00 CAD
popular info bitcoin
BTC to BRL
1 BTC to 541406.23 BRL
popular info bitcoin
BTC to INR
1 BTC to 9101881.14 INR
popular info pi-network
PI to INR
1 PI to 20.40 INR

Hot promotions

How to convert TS to ZAR

buy-coin-step-0-img
Create Your Free Bitget Account
Sign up on Bitget with your email address/mobile phone number and create a strong password to secure your account.
buy-coin-step-1-img
Verify Your Account
Verify your identity by entering your personal information and uploading a valid photo ID.
buy-coin-step-2-img
Convert TS to ZAR
Choose from cryptocurrencies to trade on Bitget.

Popular Team Shares Converter

popular info South African rand
TS to ZAR
1 TS to R0.002235 ZAR
popular info New Taiwan dollar
TS to TWD
1 TS to NT$0.004049 TWD
popular info Chinese Yuan
TS to CNY
1 TS to ¥0.0009280 CNY
popular info United States Dollar
TS to USD
1 TS to $0.0001304 USD
popular info Australian Dollar
TS to AUD
1 TS to AU$0.0001994 AUD
popular info Euro
TS to EUR
1 TS to €0.0001126 EUR
popular info Canadian Dollar
TS to CAD
1 TS to C$0.0001827 CAD
popular info South Korean Won
TS to KRW
1 TS to ₩0.1913 KRW
popular info Japanese Yen
TS to JPY
1 TS to ¥0.02017 JPY
popular info Pound Sterling
TS to GBP
1 TS to £0.{4}9925 GBP
popular info Brazilian Real
TS to BRL
1 TS to R$0.0006873 BRL

Popular cryptocurrencies to ZAR

other assets Nano
XNO to ZAR
1 XNO to R26.12 ZAR
other assets NEXPACE
NXPC to ZAR
1 NXPC to R7.12 ZAR
other assets Conflux
CFX to ZAR
1 CFX to R1.73 ZAR
other assets Lorenzo Protocol
BANK to ZAR
1 BANK to R1.4 ZAR
other assets StakeStone
STO to ZAR
1 STO to R3.07 ZAR
other assets Amp
AMP to ZAR
1 AMP to R0.04646 ZAR
other assets Meteora
MET to ZAR
1 MET to R8.46 ZAR
other assets Aster
ASTER to ZAR
1 ASTER to R19.21 ZAR
other assets KernelDAO
KERNEL to ZAR
1 KERNEL to R2.02 ZAR
other assets Allora
ALLO to ZAR
1 ALLO to R7.91 ZAR

TS to ZAR Conversion tables

The exchange rate of Team Shares is decreasing.
The exchange rate of 1 TS to South African rand has changed by --% in the last 7 days. In the last 24 hours, the rate has fluctuated by +1.63%, reaching a high of 0.002424 ZAR and a low of 0.001183 ZAR . One month ago, the value of 1 TS was R-- ZAR , which represents a --% change from its current value. Over the last year, Team Shares has changed by
-R
--ZAR
, resulting in a change of --% in its value.
24 hours ago1 month ago1 year ago
Amount 08:06 am today 24 hours ago 24h change
0.5 TS
R0.001117R--
+1.63%
1 TS
R0.002235R--
+1.63%
5 TS
R0.01117R--
+1.63%
10 TS
R0.02235R--
+1.63%
50 TS
R0.1117R--
+1.63%
100 TS
R0.2235R--
+1.63%
500 TS
R1.12R--
+1.63%
1000 TS
R2.23R--
+1.63%

TS to ZAR FAQ

How much is 1 Team Shares in ZAR?
Right now, the price of 1 Team Shares (TS) in South African rand (ZAR) is R0.002235.
How much TS can I buy for 1 ZAR?
Based on the current exchange rate, you can get 447.49 TS for 1 ZAR.
How do I calculate or convert TS to ZAR?
You can use our TS to ZAR calculator at the top of this page to convert any amount of TS to ZAR. We've also included quick-reference tables for the most popular conversions. For example, 5 ZAR is equivalent to 2,237.46 TS, while 5 TS will cost around 0.01117ZAR.
What is the highest price of TS/ZAR in history?
The all-time high price of 1 TS in ZAR is --. It remains to be seen if the value of 1 TS/ZAR will exceed the current all-time high.
What is the price trend of Team Shares in ZAR?
Over the past 7 days, the exchange rate of Team Shares (TS) has gone down by --.   Over the last month, the exchange rate of Team Shares (TS) has gone down by -- against South African rand (ZAR).

What factors influence the conversion rate of TS to ZAR?

There are many factors that affect the relationship between Team Shares and South African rand, spanning multiple dimensions such as macroeconomic trends, policy regulation, and technological innovation. Specifically, the following key factors play an important role:
Market sentiment:Investor sentiment and confidence have a significant impact on the dynamics of TS/ZAR. When there is positive news in the market about the widespread adoption of TS or major technological breakthroughs, it tends to trigger market optimism and drive the rise of TS/ZAR. Conversely, negative news, such as regulatory crackdowns and security vulnerabilities, may trigger market panic and lead to a decline in TS/ZAR.
Regulatory environment:Government policies and regulations surrounding cryptocurrencies have a direct impact on their acceptance, which in turn determines their value relative to traditional currencies such as the US dollar. Clear and supportive regulations can enhance investor confidence in cryptocurrencies and drive their value up. Conversely, vague or overly strict regulatory policies may hinder the development of cryptocurrencies and cause their value to fall.
Economic indicators:Macroeconomic factors in the country where the fiat currency is issued—such as inflation rates, interest rates, and key economic growth indicators—play a crucial role in determining the fiat currency's value and indirectly affect the exchange rate of TS/ZAR. For example, high inflation rates may lead to a decrease in market trust in fiat currencies, thereby increasing investors' demand for cryptocurrencies such as Bitcoin as a hedge, driving up their prices.
Technological progress:The continuous development and innovation of blockchain technology, as well as various improvements in the cryptocurrency ecosystem—such as expansion solutions and security enhancements—have provided strong support for the value growth of cryptocurrencies like Bitcoin.
Investors must understand these dynamics to avoid making wrong decisions. After considering these factors, investors should also closely monitor future changes in the price of Team Shares and adjust their investment strategies accordingly in the evolving market.

Popular exchange rates — Crypto-to-Fiat converter

Bitget crypto-to-fiat exchange data shows the popular Team Shares currency pairs: TS to US Dollar (USD), TS to Euro (EUR), TS to Pound Sterling (GBP), TS to Canadian Dollar (CAD), TS to Indian Rupee (INR), TS to Pakistani Rupee (PKR), TS to Brazilian Real (BRL), TS to…
The price of Team Shares in the US is $0.0001304 USD. Additionally, Team Shares’s price is €0.0001126 EUR in the eurozone, £0.{4}9925 GBP in the UK, C$0.0001827 CAD in Canada, ₹0.01155 INR in India, ₨0.03687 PKR in Pakistan, R$0.0006873 BRL in Brazil, and more.
The most popular Team Shares currency pair is the TS to South African rand(ZAR). The price of 1 Team Shares (TS) in South African rand (ZAR) is R0.002235.

Popular fiat

Popular areas

Purchase other cryptocurrencies with similar market cap

This content is being provided to you for informational purposes only, does not constitute an offer, or solicitation of an offer nor a recommendation by Bitget to buy, sell, or hold any security, financial product, or instrument referenced in the content, and does not constitute investment advice, financial advice, trading advice, or any other sort of advice. Data presented may reflect asset prices traded on the Bitget exchange as well as other cryptocurrency exchanges and market data platforms. Bitget may charge fees for the processing of cryptocurrency transactions which may not be reflected in the conversion prices displayed. Bitget is not liable for any errors or delays in content or for any actions taken in reliance on any content.