
Bitcoin Price Eyes Fresh Bullish Breakout, Can BTC Make It To $45K?
Bitcoin price corrected gains and tested the $42,650 zone. BTC is again attempting a fresh increase and eyeing a move above the $43,750 resistance.
- Bitcoin found support above the $42,500 zone and started a fresh increase.
- The price is trading below $43,550 and the 100 hourly Simple moving average.
- There is a connecting bearish trend line forming with resistance near $43,600 on the hourly chart of the BTC/USD pair .
- The pair could start a fresh increase if it clears the $43,750 and $44,300 resistance levels.
Bitcoin Price Holds Ground
Bitcoin price failed to clear the $44,300 resistance zone and started a downside correction. BTC declined below $43,500 level, but the bulls were active above the $42,500 zone.
A low was formed near $42,860 and the price is now attempting a fresh increase. There was a move above the $43,200 resistance zone. The price climbed above the 50% Fib retracement level of the downward move from the $44,429 swing high to the $42,680 low.
Bitcoin is still trading below $43,550 and the 100 hourly Simple moving average. There is also a connecting bearish trend line forming with resistance near $43,600 on the hourly chart of the BTC/USD pair.
The trend line is close to the 61.8% Fib retracement level of the downward move from the $44,429 swing high to the $42,680 low. On the upside, immediate resistance is near the $43,550 level. The first major resistance is forming near the trend line.
A close above the $43,600 resistance could start a decent move toward the $44,300 level. The next key resistance could be near $45,000, above which BTC could rise toward the $46,500 level. Any more gains might send the price toward $47,200.
Another Decline In BTC?
If Bitcoin fails to rise above the $43,600 resistance zone, it could start a fresh decline. Immediate support on the downside is near the $43,000 level.
The next major support is near $42,600. If there is a move below $42,600, there is a risk of more losses. In the stated case, the price could drop toward the $42,000 support in the near term.
Technical indicators:
Hourly MACD – The MACD is now losing pace in the bearish zone.
Hourly RSI (Relative Strength Index) – The RSI for BTC/USD is now near the 50 level.
Major Support Levels – $43,000, followed by $42,600.
Major Resistance Levels – $43,600, $44,000, and $44,300.
Disclaimer: The content of this article solely reflects the author's opinion and does not represent the platform in any capacity. This article is not intended to serve as a reference for making investment decisions.
You may also like
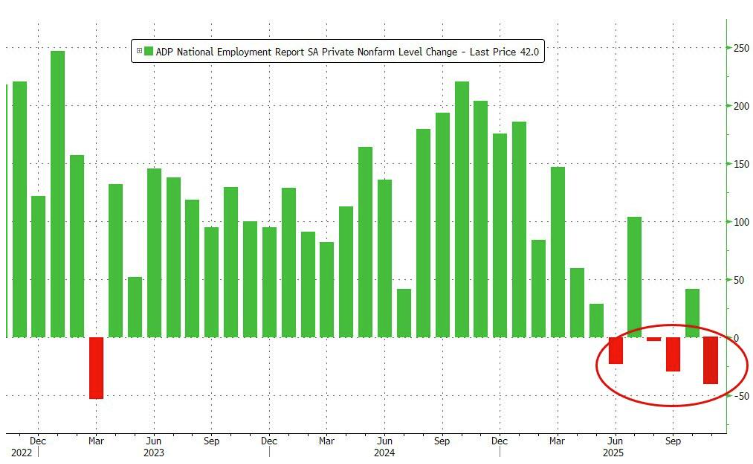
ADP data sounds the alarm again: US companies cut 11,000 jobs per week
The government shutdown has delayed official employment data, so ADP data has stepped in to reveal the truth: in the second half of October, the labor market slowed down, and the private sector lost a total of 45,000 jobs for the entire month, marking the largest decline in two and a half years.
The US SEC and CFTC may accelerate the development of crypto regulations and products.
The Most Understandable Fusaka Guide on the Internet: A Comprehensive Analysis of Ethereum Upgrade Implementation and Its Impact on the Ecosystem
The upcoming Fusaka upgrade on December 3 will have a broader scope and deeper impact.

Established projects defy the market trend with an average monthly increase of 62%—what are the emerging narratives behind this "new growth"?
Although these projects are still generally down about 90% from their historical peaks, their recent surge has been driven by multiple factors.