Ethereum Price Rejects $2,600, Can Bulls Save This Key Support?
Ethereum price struggled to extend gains above $2,600 and $2,620. ETH trimmed gains and might struggle to stay above the $2,500 support zone.
- Ethereum attempted a fresh increase but failed to surpass $2,620.
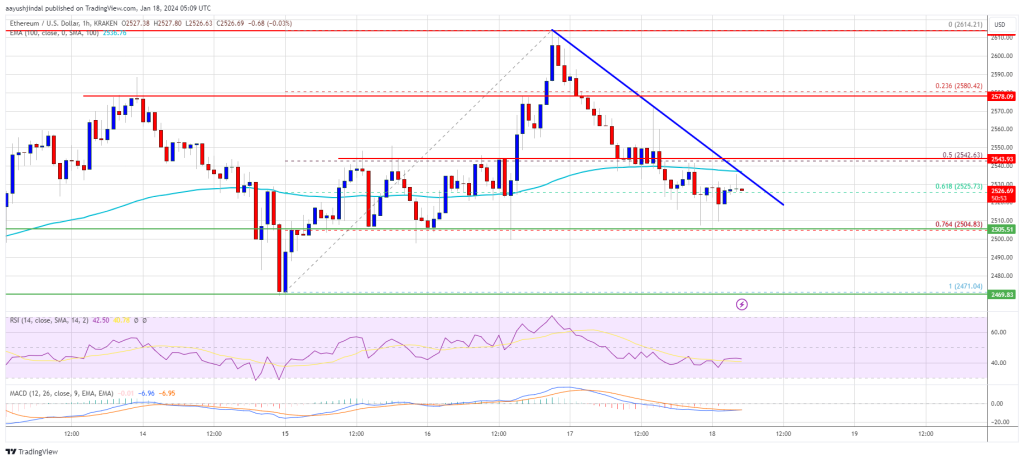
- The price is trading below $2,550 and the 100-hourly Simple Moving Average.
- There is a key bearish trend line forming with resistance near $2,540 on the hourly chart of ETH/USD (data feed via Kraken).
- The pair start another increase if the bulls protect the $2,500 and $2,470 support levels.
Ethereum Price Revisits Support
Ethereum price started a fresh increase above the $2,520 resistance zone. ETH even climbed above the $2,550 level, but the bears were active near $2,600, like Bitcoin .
The price traded as high as $2,614 and recently started a fresh decline. There was a move below the $2,550 support zone. The price traded below the 61.8% Fib retracement level of the upward wave from the $2,471 swing low to the $2,614 high.
Ethereum is now trading below $2,550 and the 100-hourly Simple Moving Average . The bulls seem to be currently active above the 76.4% Fib retracement level of the upward wave from the $2,471 swing low to the $2,614 high.
On the upside, the price is facing resistance near the $2,540 level. There is also a key bearish trend line forming with resistance near $2,540 on the hourly chart of ETH/USD. The next major resistance is now near $2,580. A clear move above the $2,580 level might start a decent increase. In the stated case, the price could rise toward the $2,620 level.

Source: ETHUSD on TradingView.com
The next key hurdle sits near the $2,650 zone. A close above the $2,650 resistance could start another steady increase. The next key resistance is near $2,720. Any more gains might send the price toward the $2,800 zone.
Downside Break in ETH?
If Ethereum fails to clear the $2,540 resistance, it could start another decline. Initial support on the downside is near the $2,500 level.
The next key support could be the $2,470 zone. A downside break below the $2,470 support might send the price further lower. In the stated case, Ether could test the $2,400 support. Any more losses might send the price toward the $2,350 level.
Technical Indicators
Hourly MACD – The MACD for ETH/USD is gaining momentum in the bearish zone.
Hourly RSI – The RSI for ETH/USD is now below the 50 level.
Major Support Level – $2,500
Major Resistance Level – $2,540
Disclaimer: The content of this article solely reflects the author's opinion and does not represent the platform in any capacity. This article is not intended to serve as a reference for making investment decisions.
You may also like
Key Market Intelligence for November 6: How Much Did You Miss?
1. On-chain funds: $61.9M flowed into Hyperliquid today; $54.4M flowed out of Arbitrum. 2. Largest price changes: $SAPIEN, $MMT. 3. Top news: ZEC surpassed $500, marking a 575% increase since Naval’s call.

Robinhood is building a financial institution tailored for the new generation
Robinhood's crypto revenue grew by 300% in the third quarter, with total revenue reaching $1.27 billions.

Soros predicts an AI bubble: We live in a self-fulfilling market
When the market starts to "speak": an earnings report experiment and a trillion-dollar AI prophecy.

Investing in top VCs but principal halved in four years—what’s happening to crypto funds?
Some crypto funds have outperformed bitcoin during bull markets through leverage or early positioning, offering risk hedging and diversification opportunities; however, their long-term performance has been inconsistent.
