
Why is the bitcoin market facing the risk of a deep correction?

Written by: Chris Beamish, Antoine Colpaert, CryptoVizArt, Glassnode
Translated by: AididiaoJP, Foresight News
Original Title: Epic Turnover and Scale of Selling, Market May Face Further Deep Correction
Bitcoin has shown signs of weakness after the FOMC-driven rally. Long-term holders have realized profits on 3.4 million BTC, while ETF inflows have slowed. Under pressure in both spot and futures markets, the short-term holder cost basis of $111,000 is a key support level; if lost, the risk of a deeper cooldown may arise.
Summary
-
After the FOMC-driven rally, Bitcoin has entered a correction phase, showing signs of a “buy the rumor, sell the news” market, with broader market structure pointing to weakening momentum.
-
The current 8% decline remains relatively mild, but the $67.8 billion realized market cap inflow and 3.4 million BTC in profits realized by long-term holders highlight the unprecedented scale of capital rotation and selling in this cycle.
-
ETF inflows slowed sharply around the FOMC meeting, while long-term holder selling accelerated, creating a fragile balance of capital flows.
-
Spot trading volume surged during the sell-off, and the futures market saw sharp deleveraging volatility. Liquidation clusters revealed the vulnerability of the market to liquidity-driven swings in both directions.
-
The options market repriced aggressively, skew soared, and demand for put options was strong, indicating defensive positioning. The macro backdrop suggests growing market exhaustion.
From Rally to Correction
Following the FOMC-driven rally, with prices peaking near $117,000, Bitcoin has transitioned into a correction phase, echoing the typical “buy the rumor, sell the news” pattern. In this issue, we look beyond short-term fluctuations to assess the broader market structure, using long-term on-chain indicators, ETF demand, and derivatives positioning to evaluate whether this pullback is a healthy consolidation or the early stage of a deeper contraction.
On-chain Analysis
Volatility Context
The current drop from the all-time high (ATH) of $124,000 to $113,700 is only 8% (the latest drop has reached 12%), which is mild compared to the 28% drawdown in this cycle or the 60% drawdowns in previous cycles. This aligns with the long-term trend of declining volatility, both between macro cycles and within-cycle phases, similar to the steady advance of 2015-2017, though the late-stage parabolic rally has not yet appeared.
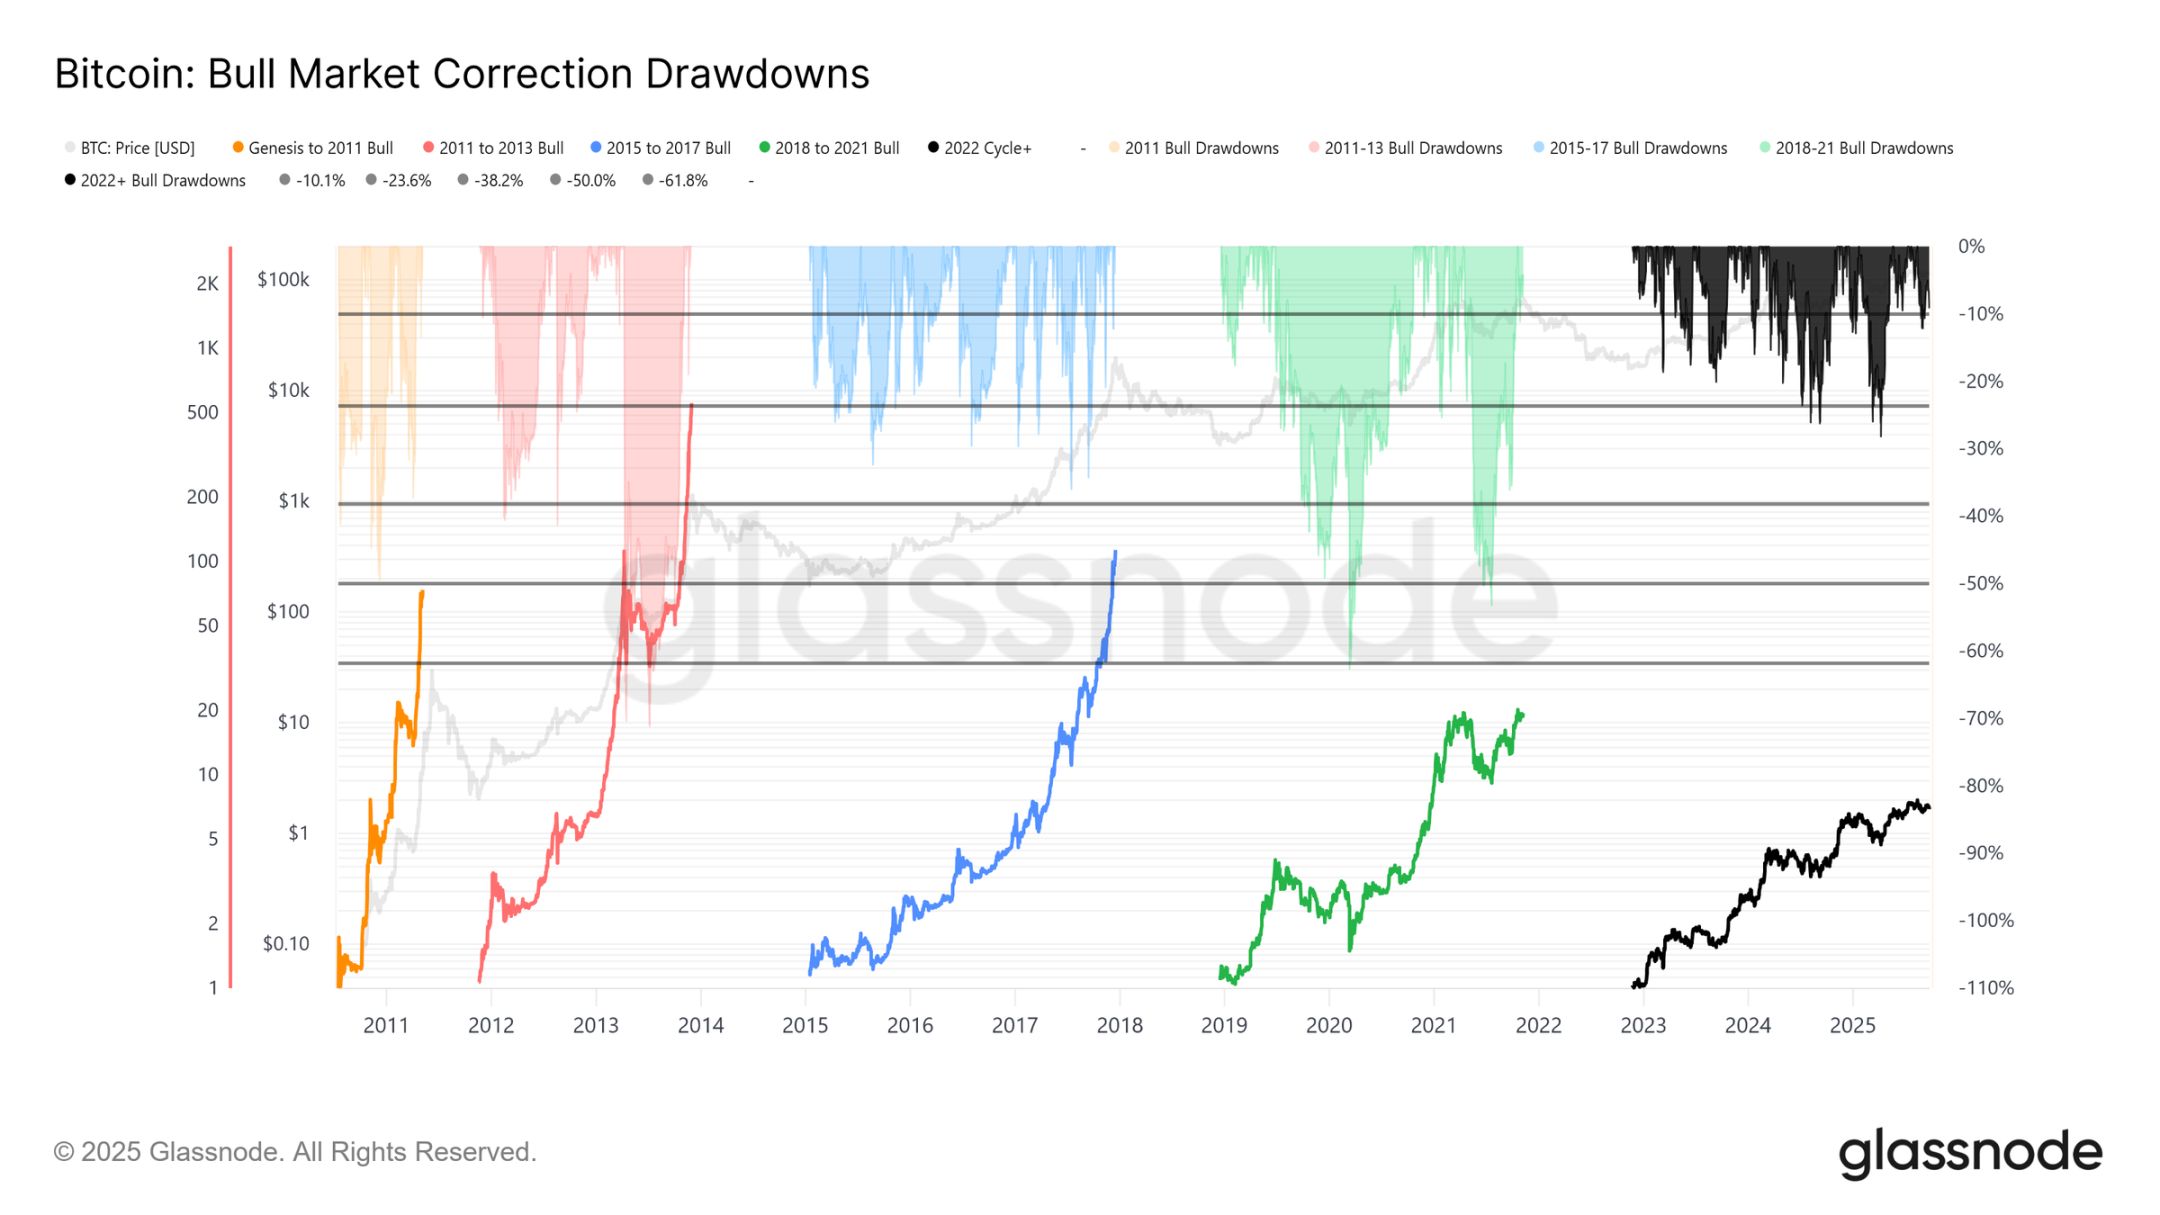
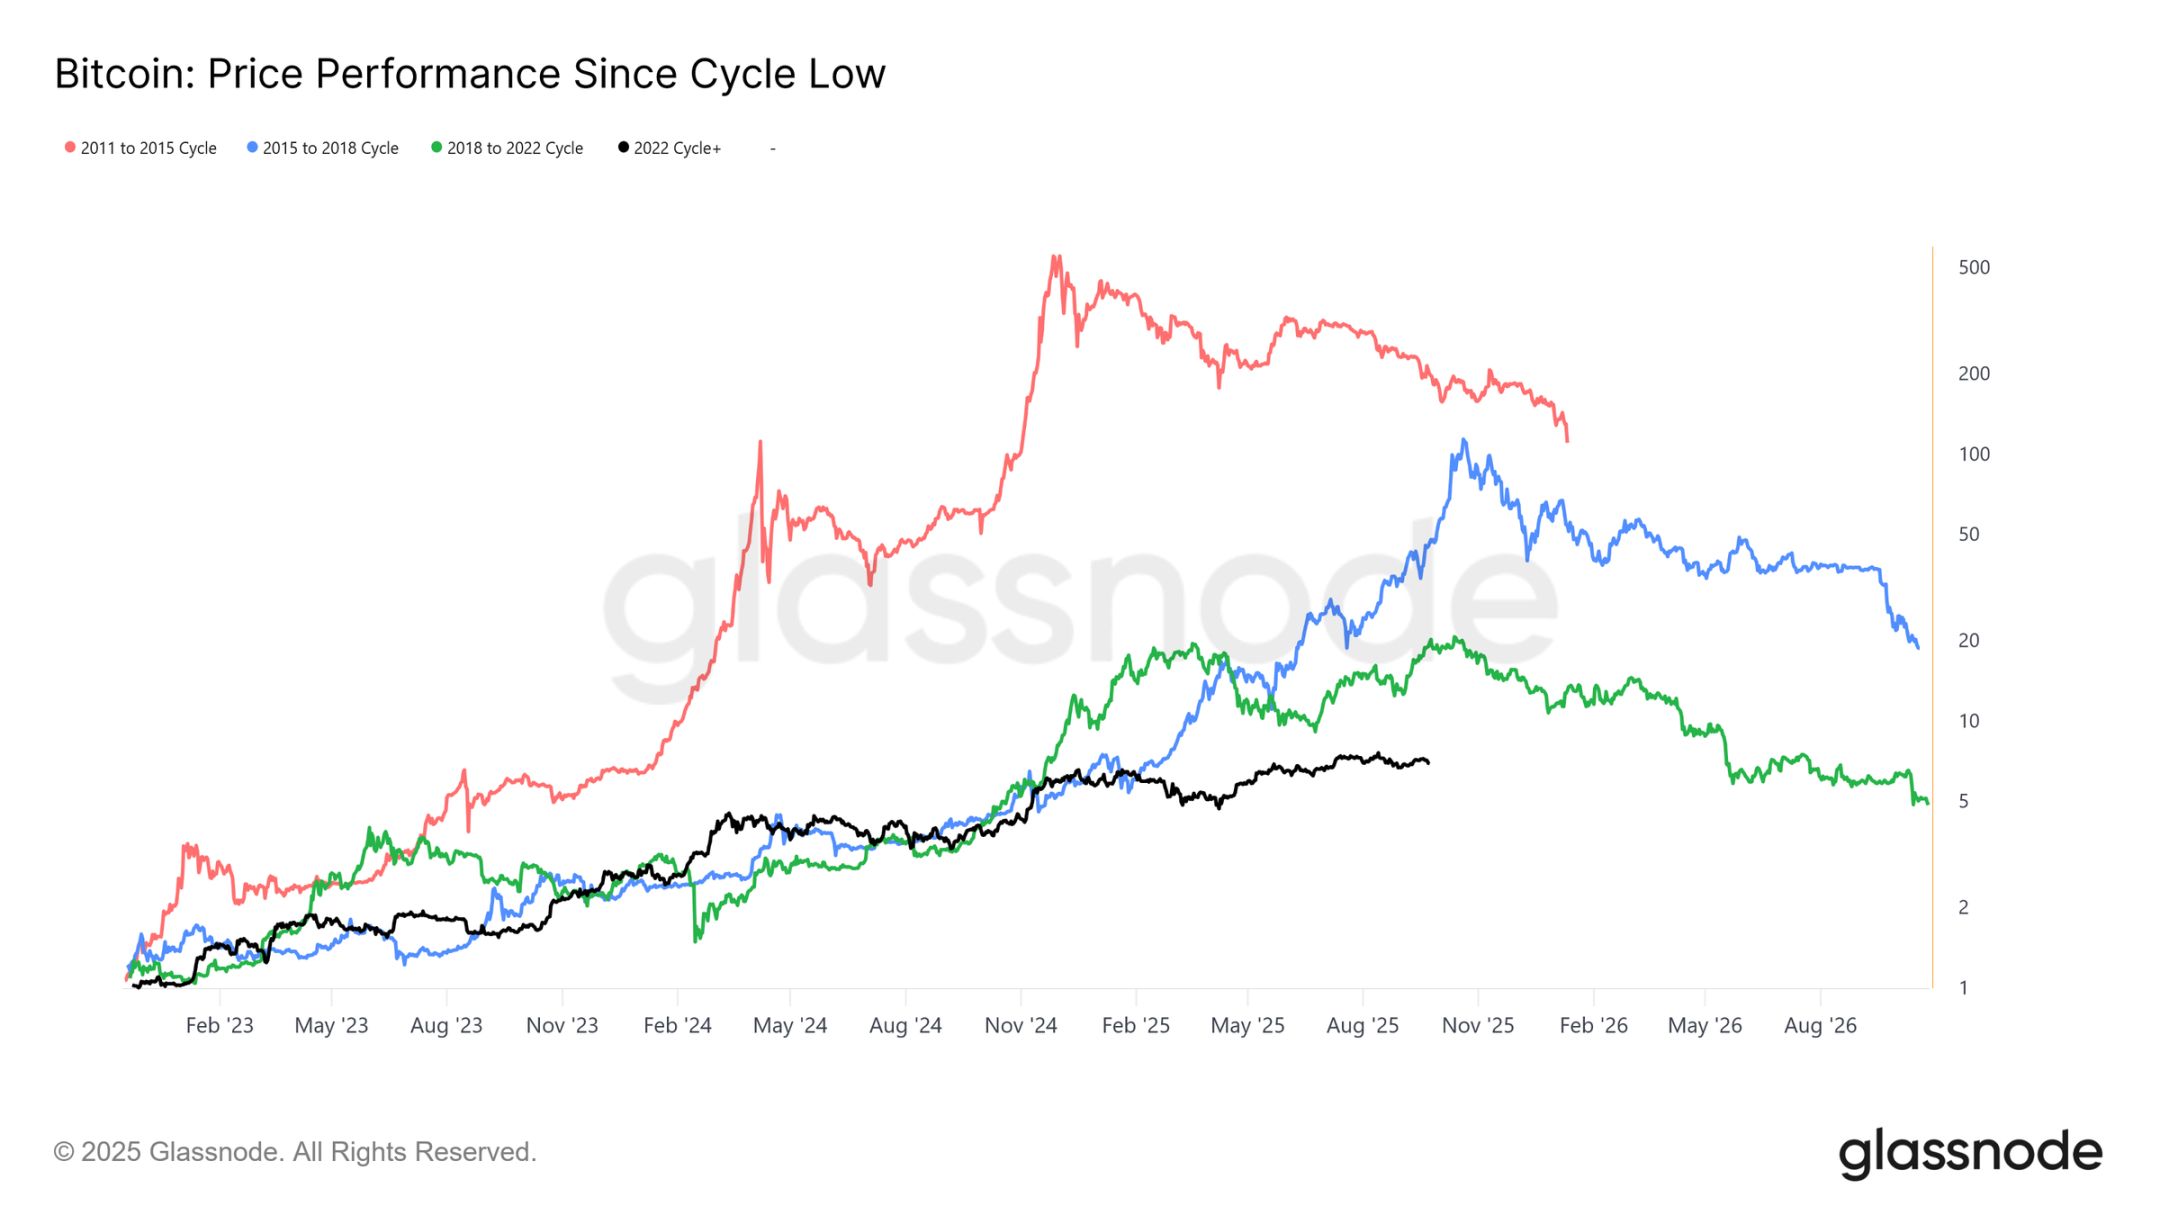
Cycle Duration
Overlaying the past four cycles shows that even though the current trajectory closely matches the previous two cycles, peak returns have diminished over time. Assuming $124,000 marks the global top, this cycle has lasted about 1,030 days, very close to the roughly 1,060 days of the previous two cycles.
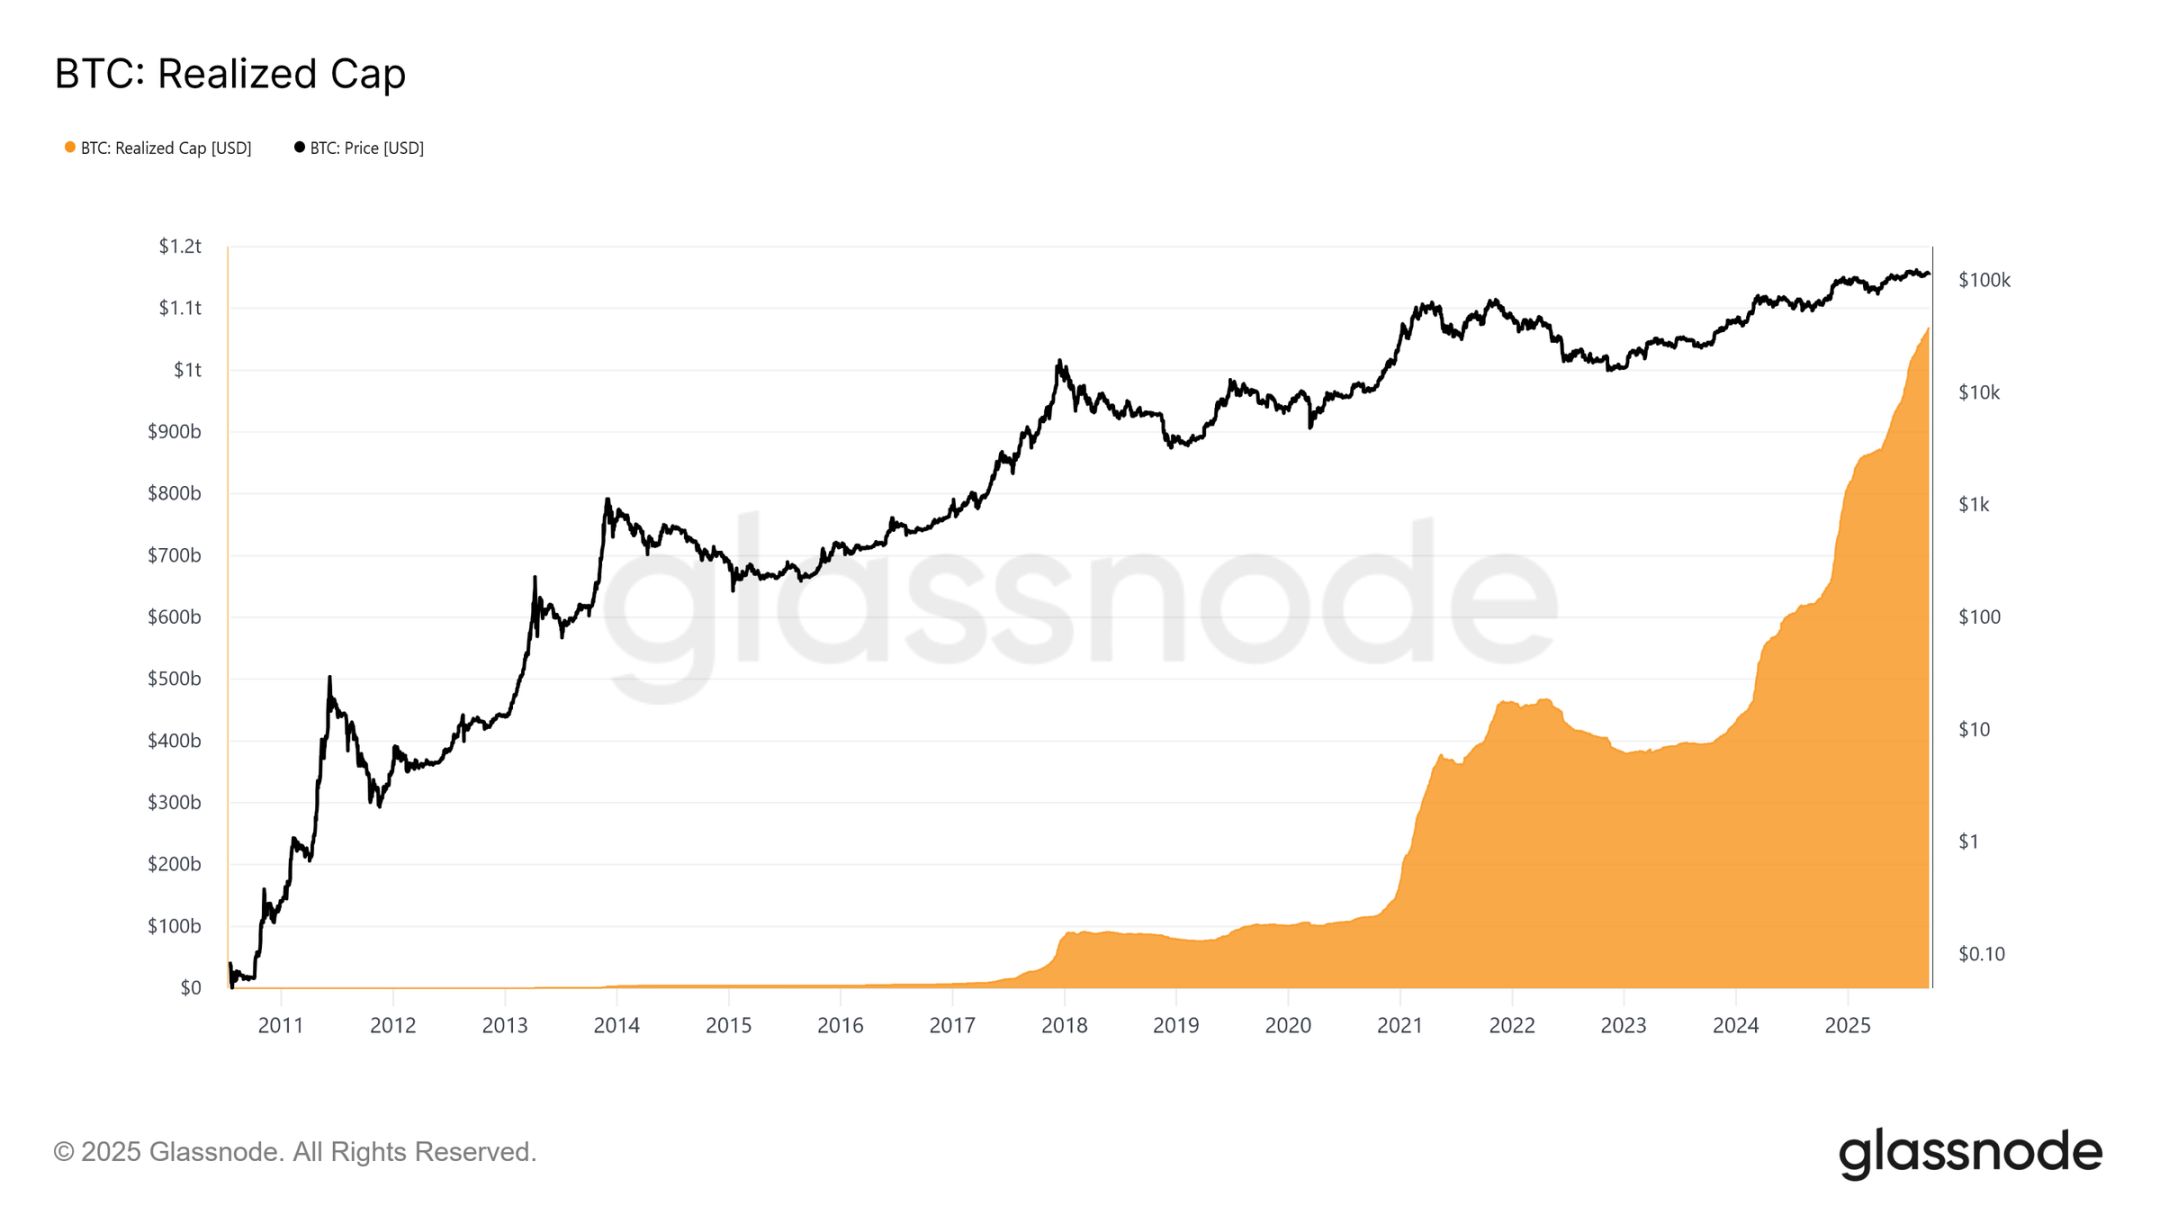
Capital Inflow Measurement
Beyond price action, capital deployment provides a more reliable perspective.
Realized market cap has seen three waves of increase since November 2022, bringing the total to $1.06 trillion, reflecting the scale of capital inflows supporting this cycle.
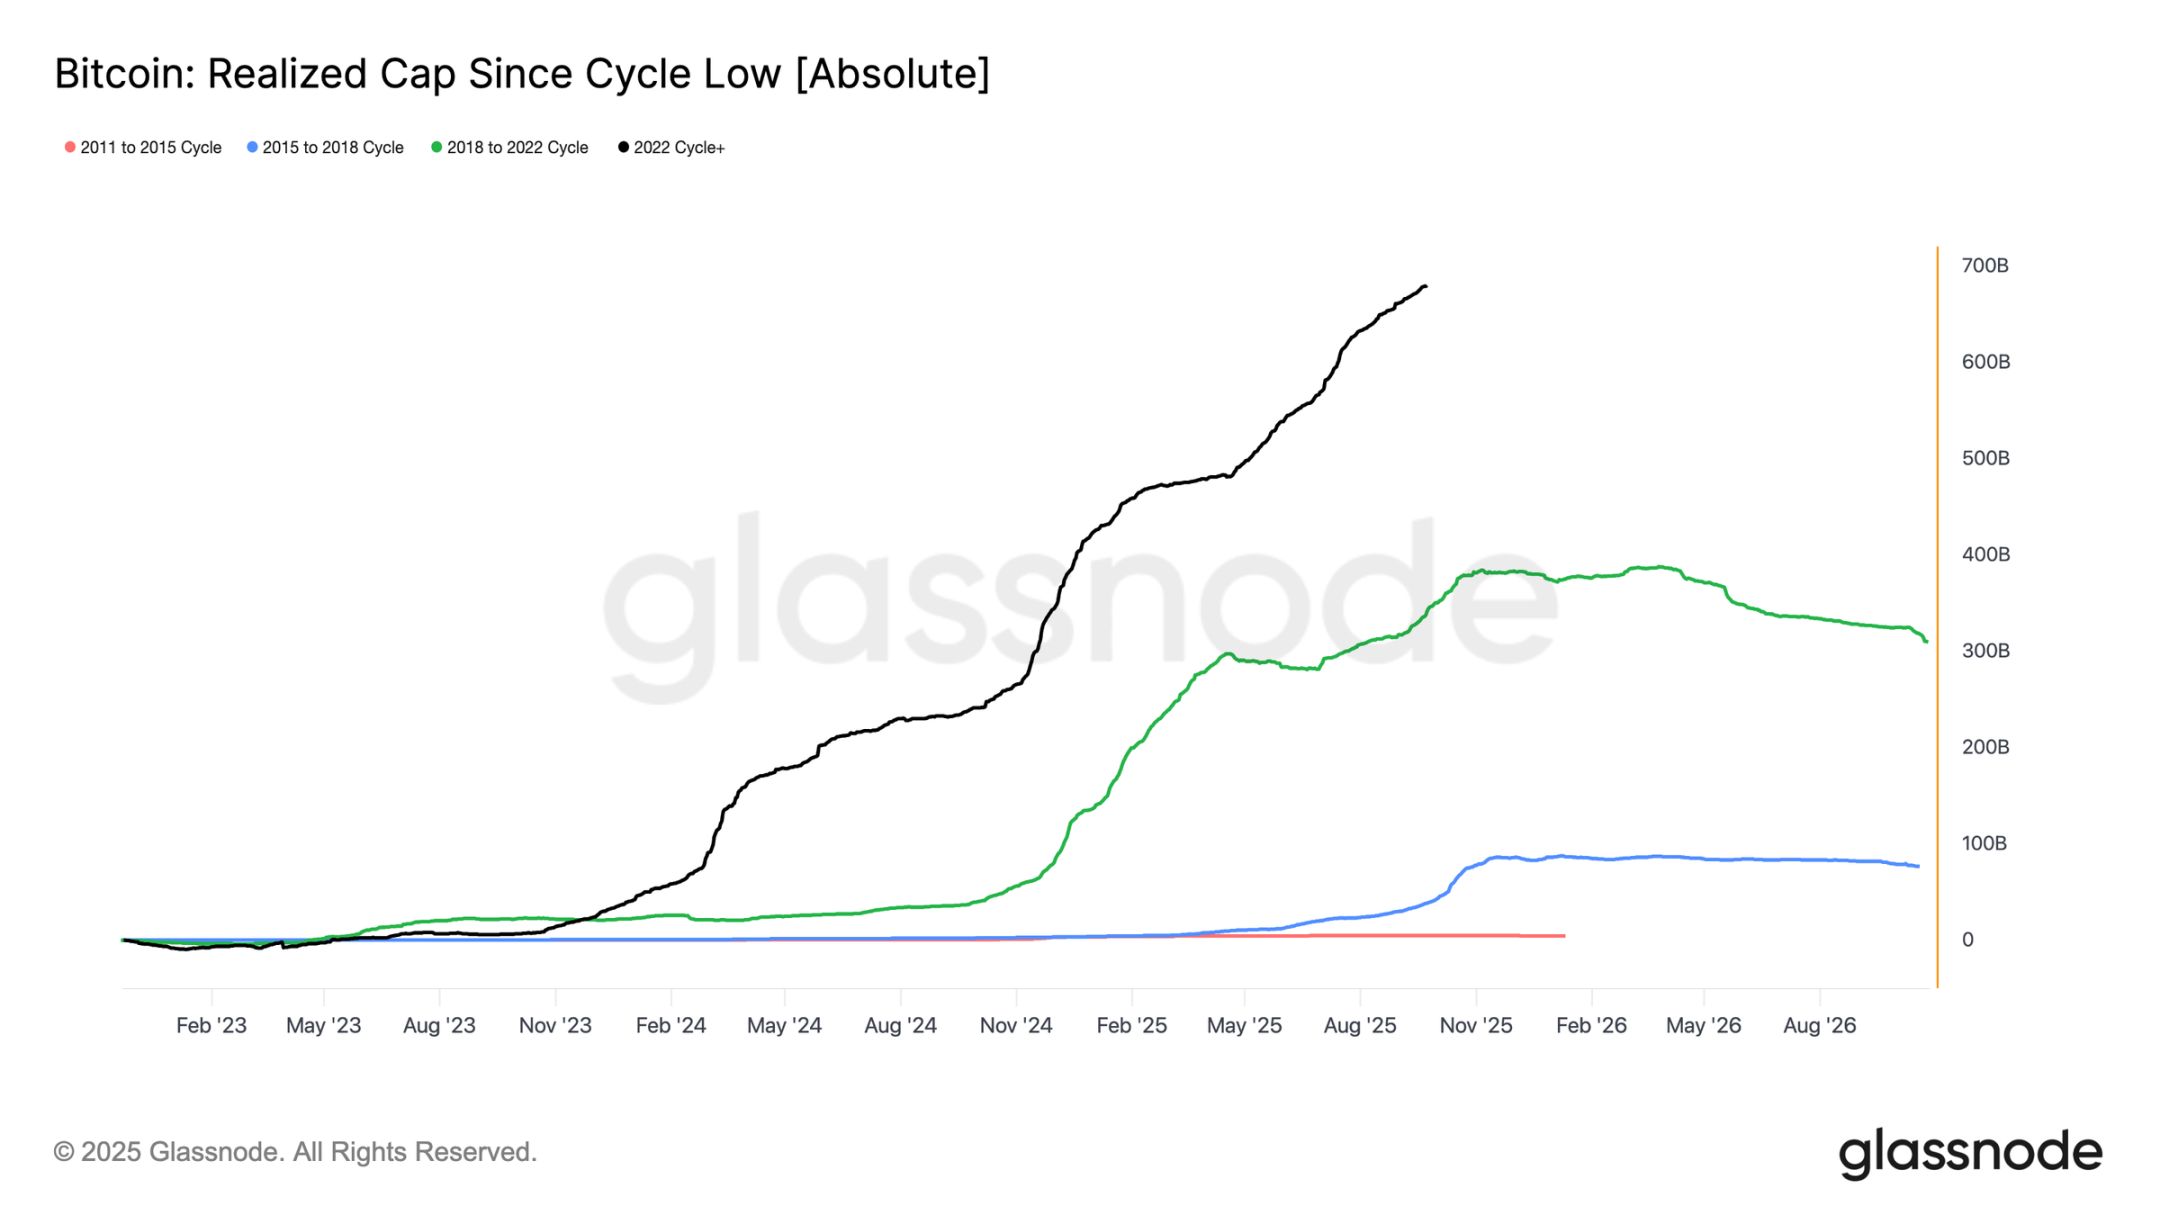
Realized Market Cap Growth
Background comparison:
-
2011–2015: $4.2 billion
-
2015–2018: $85 billion
-
2018–2022: $383 billion
-
2022–present: $67.8 billion
This cycle has absorbed $67.8 billion in net inflows, almost 1.8 times the previous cycle, highlighting the unprecedented scale of capital rotation.
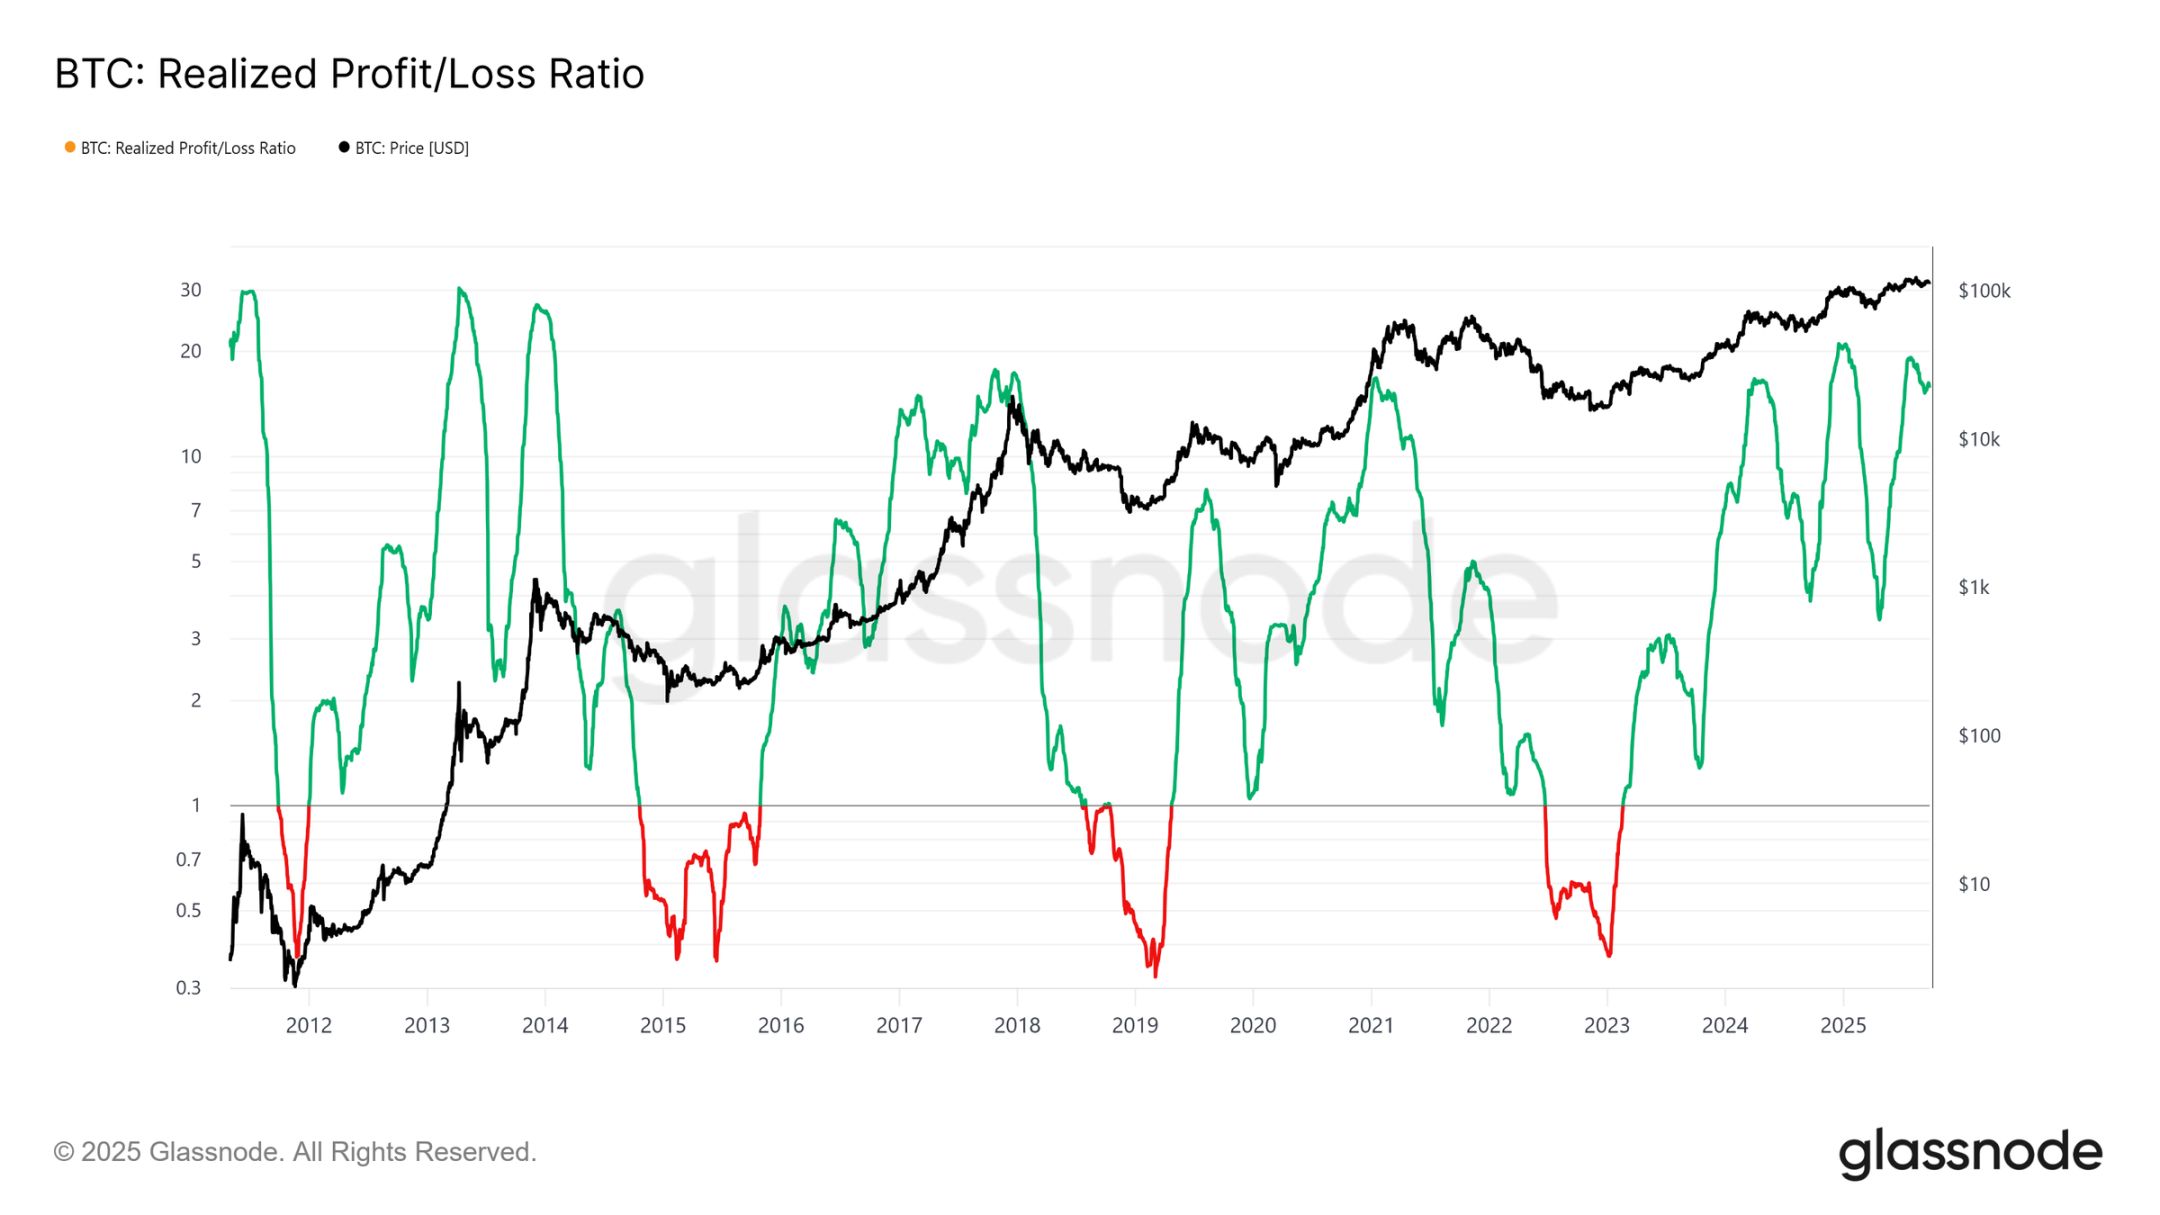
Profit Realization Peaks
Another difference lies in the structure of inflows. Unlike the single wave of earlier cycles, this cycle has seen three distinct, months-long surges. The realized profit/loss ratio shows that each time profits realized exceed 90% of moved tokens, it marks a cyclical peak. Having just exited the third such extreme, the probability now favors a cooling-off phase ahead.
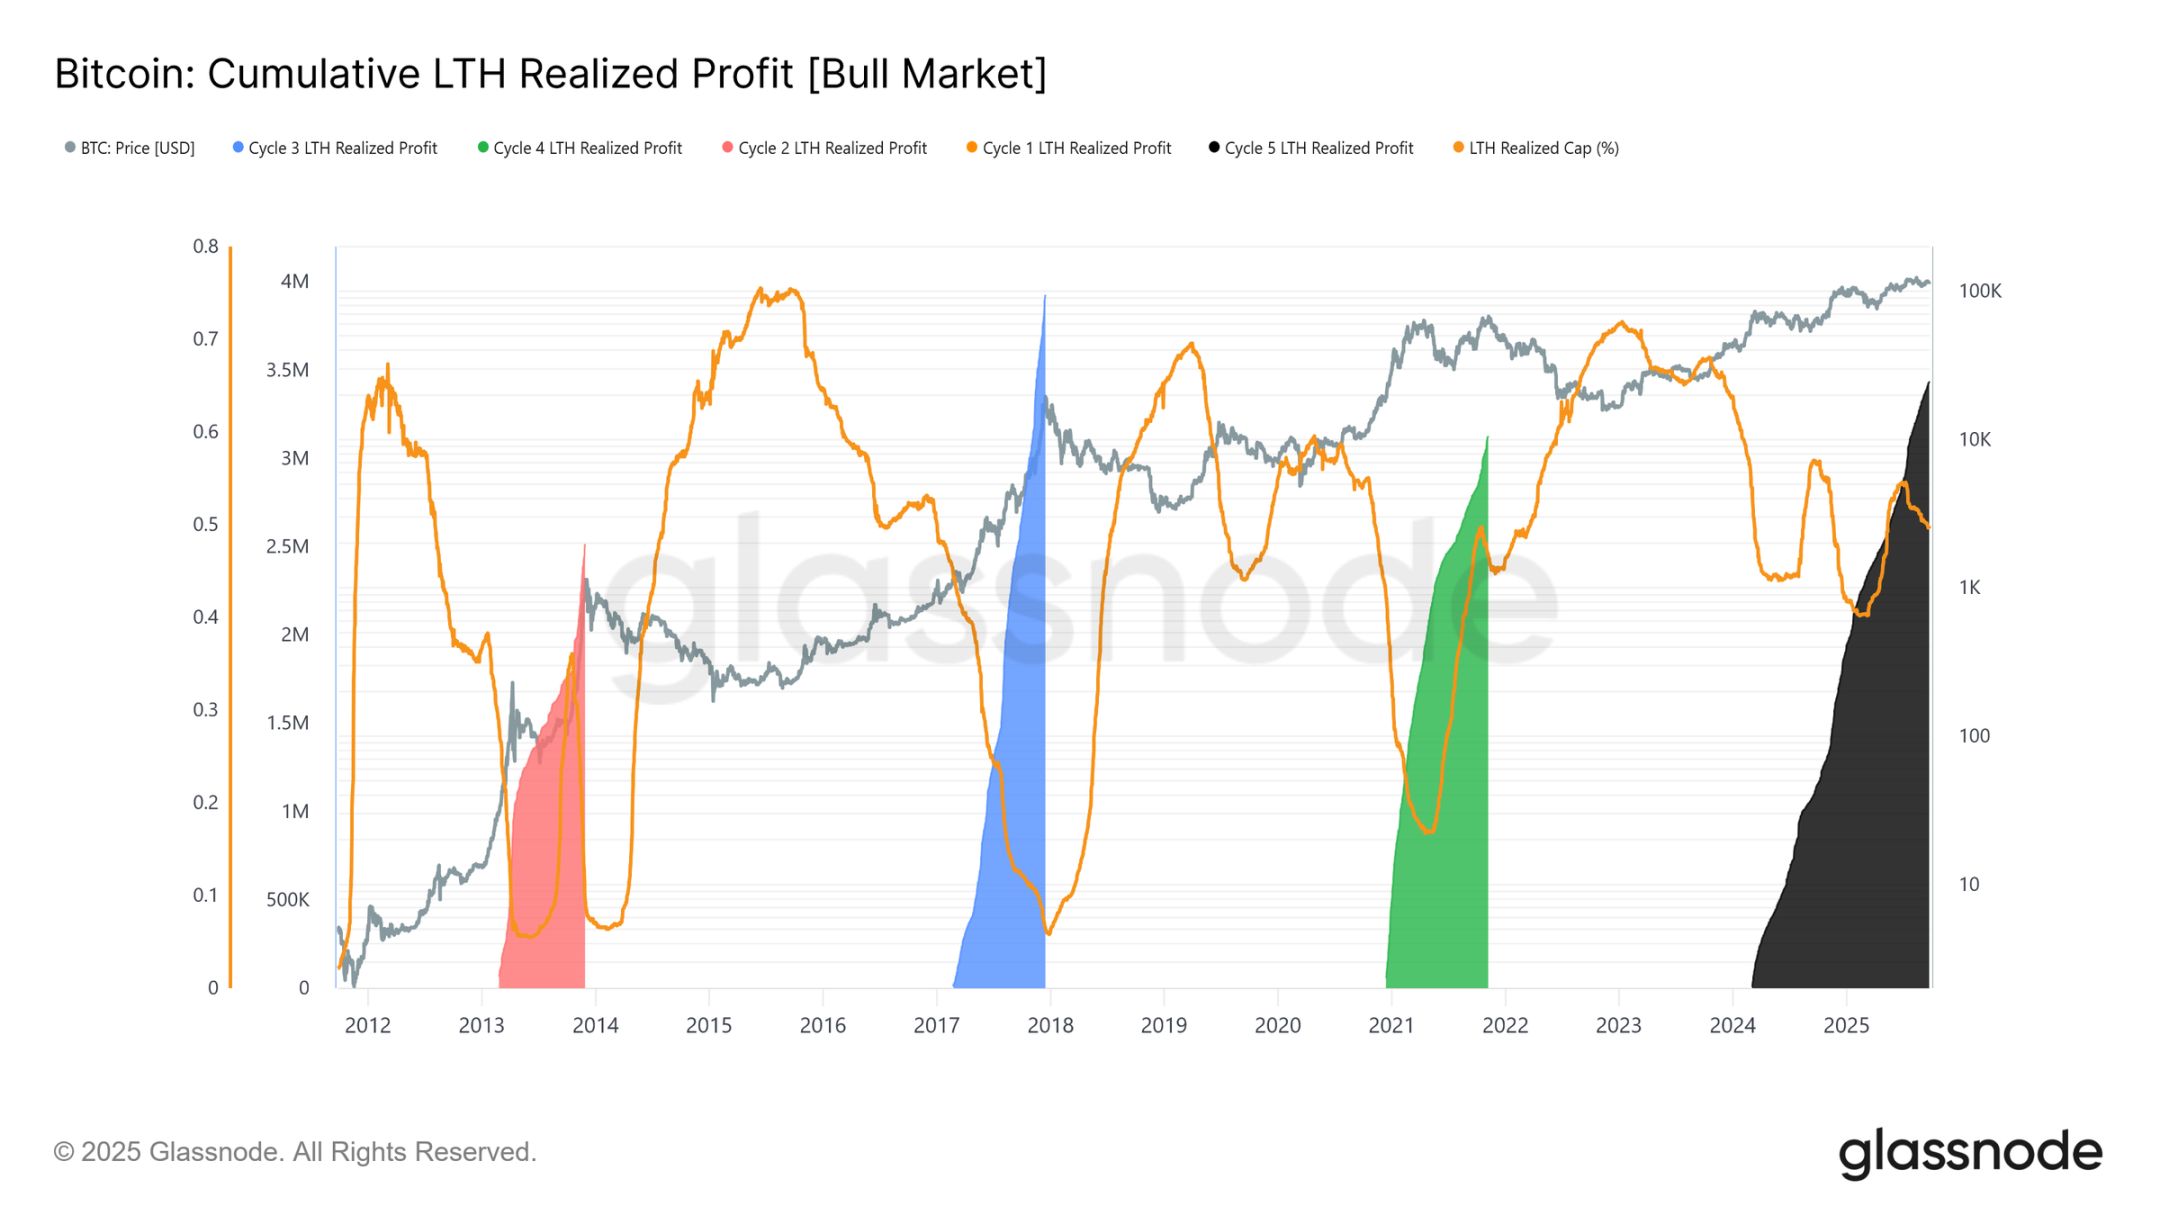
Long-term Holder Profit Dominance
Focusing on long-term holders, the scale becomes even clearer. This metric tracks the cumulative profits of long-term holders from new ATH to cycle peak. Historically, their heavy selling has marked the top. In this cycle, long-term holders have realized profits on 3.4 million BTC, already surpassing previous cycles, highlighting the maturity of this group and the scale of capital rotation.
Off-chain Analysis
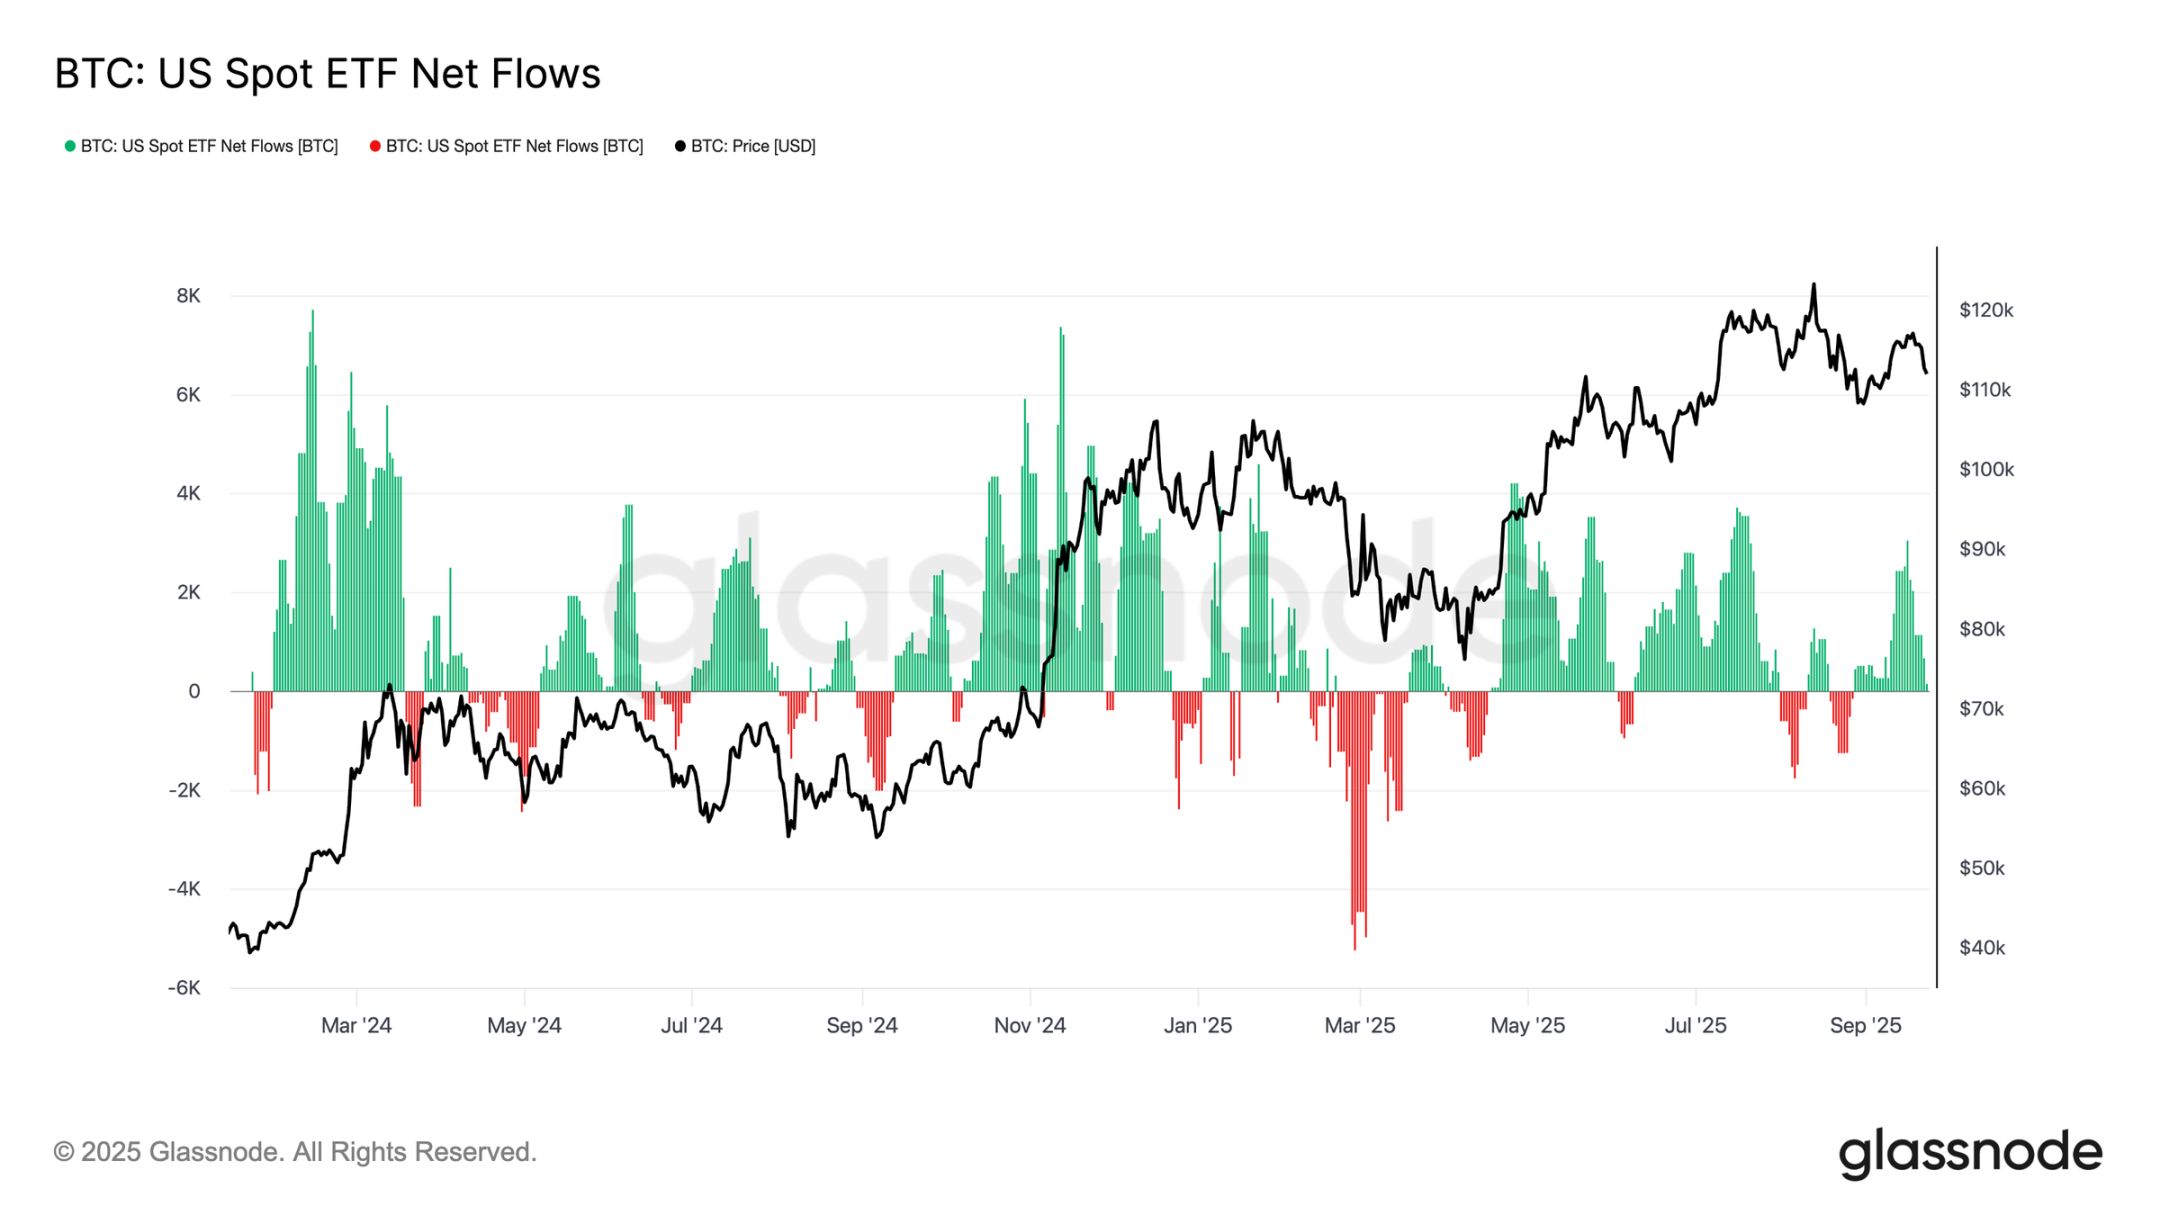
ETF Demand vs. Long-term Holders
This cycle is also characterized by a tug-of-war between long-term holder selling and institutional demand via US spot ETFs and DATs. As ETFs become a new structural force, prices now reflect this push-pull effect: long-term holder profit-taking caps the upside, while ETF inflows absorb selling and sustain the cycle’s progress.
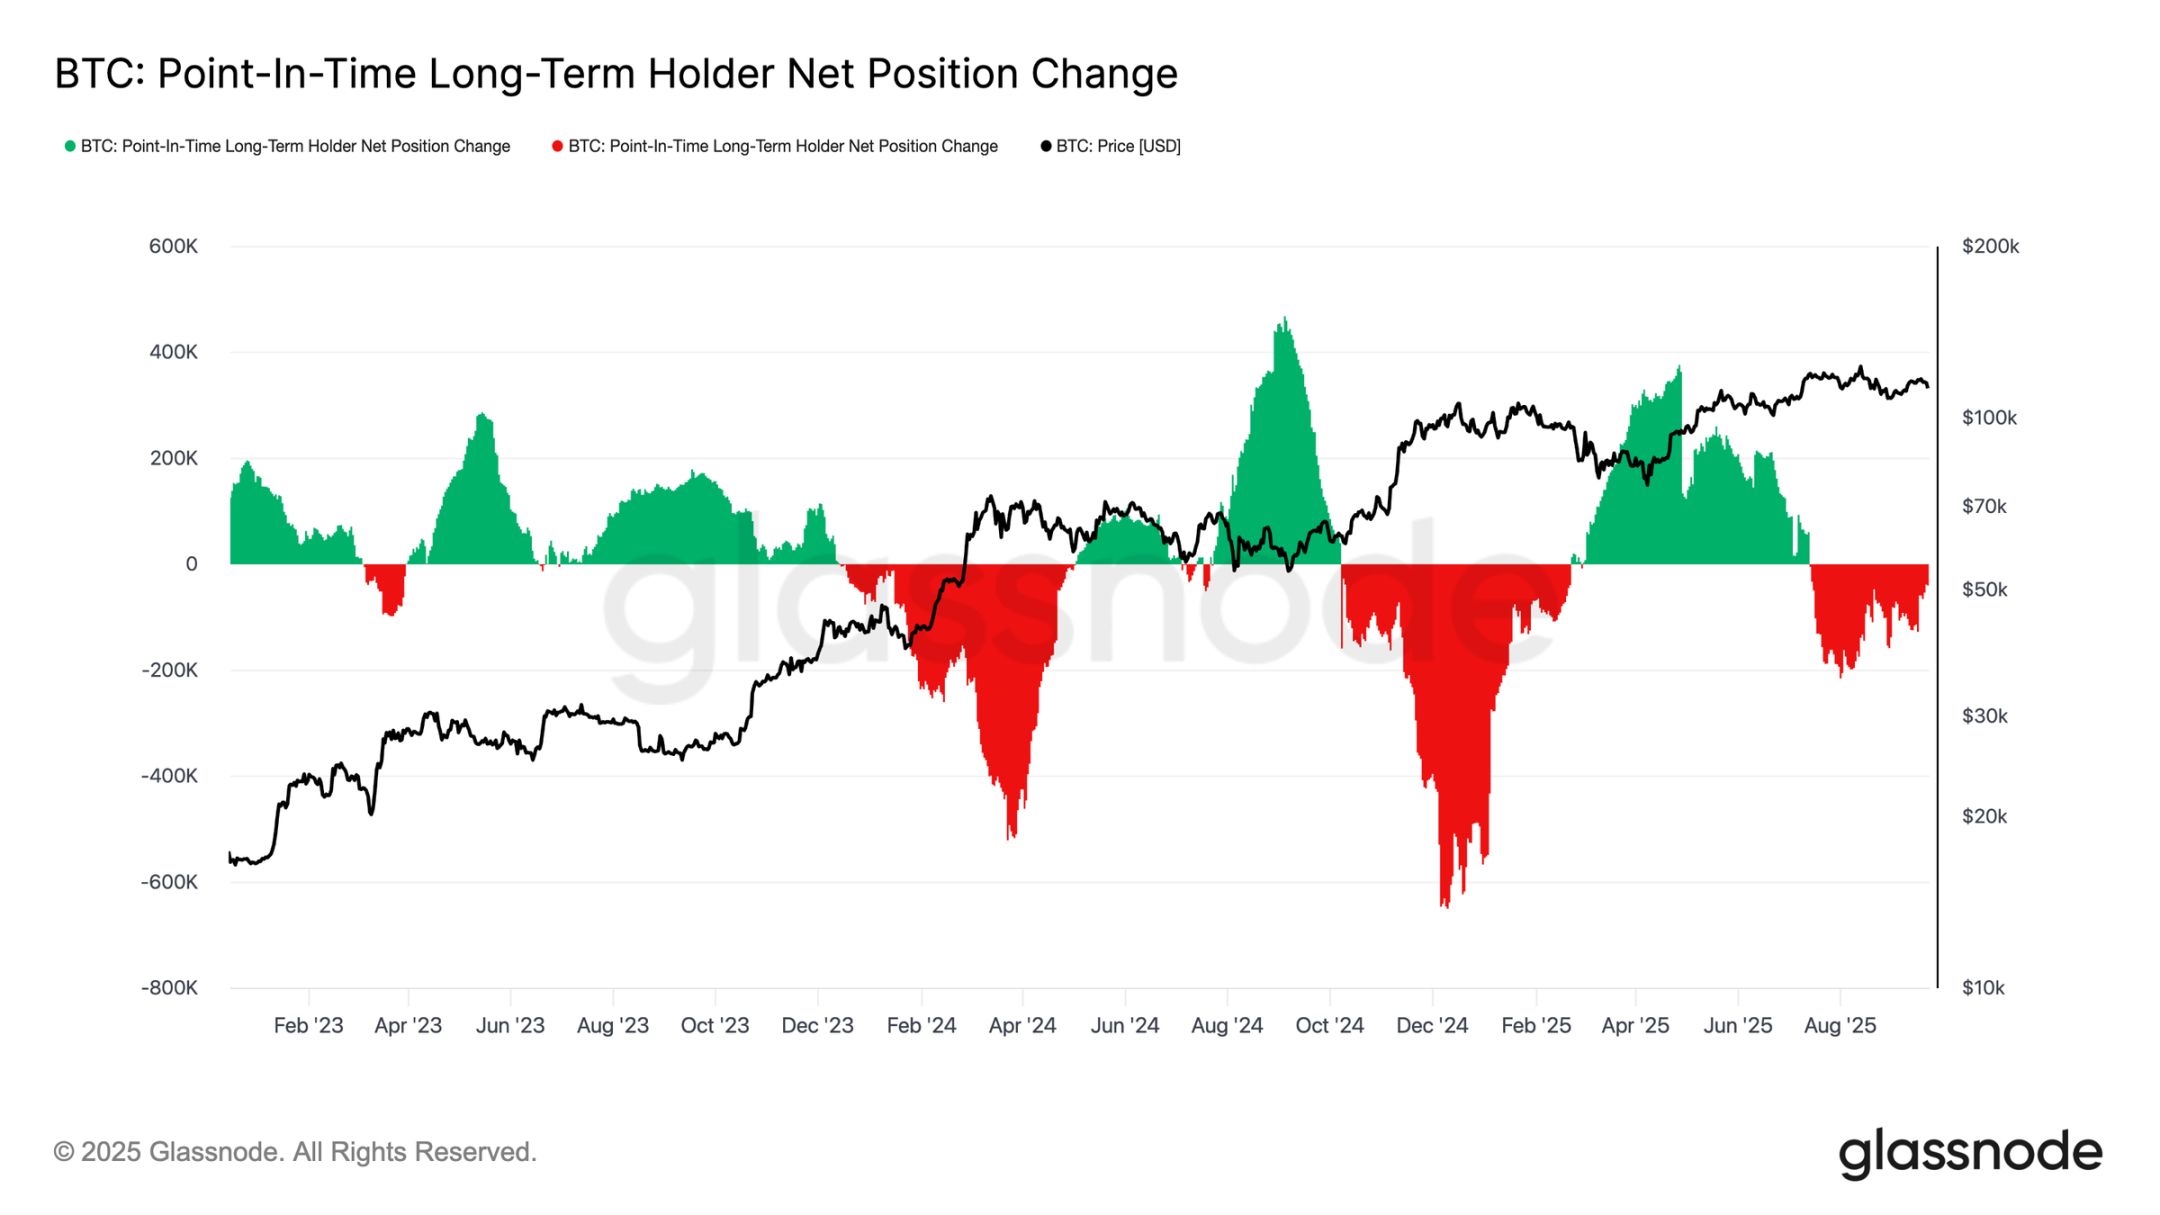
Fragile Balance
ETF inflows have so far balanced long-term holder selling, but the margin for error is slim. Around the FOMC meeting, long-term holder selling surged to 122,000 BTC/month, while ETF net inflows plunged from 2,600 BTC/day to near zero. The combination of increased selling pressure and weakened institutional demand created a fragile backdrop, setting the stage for weakness.
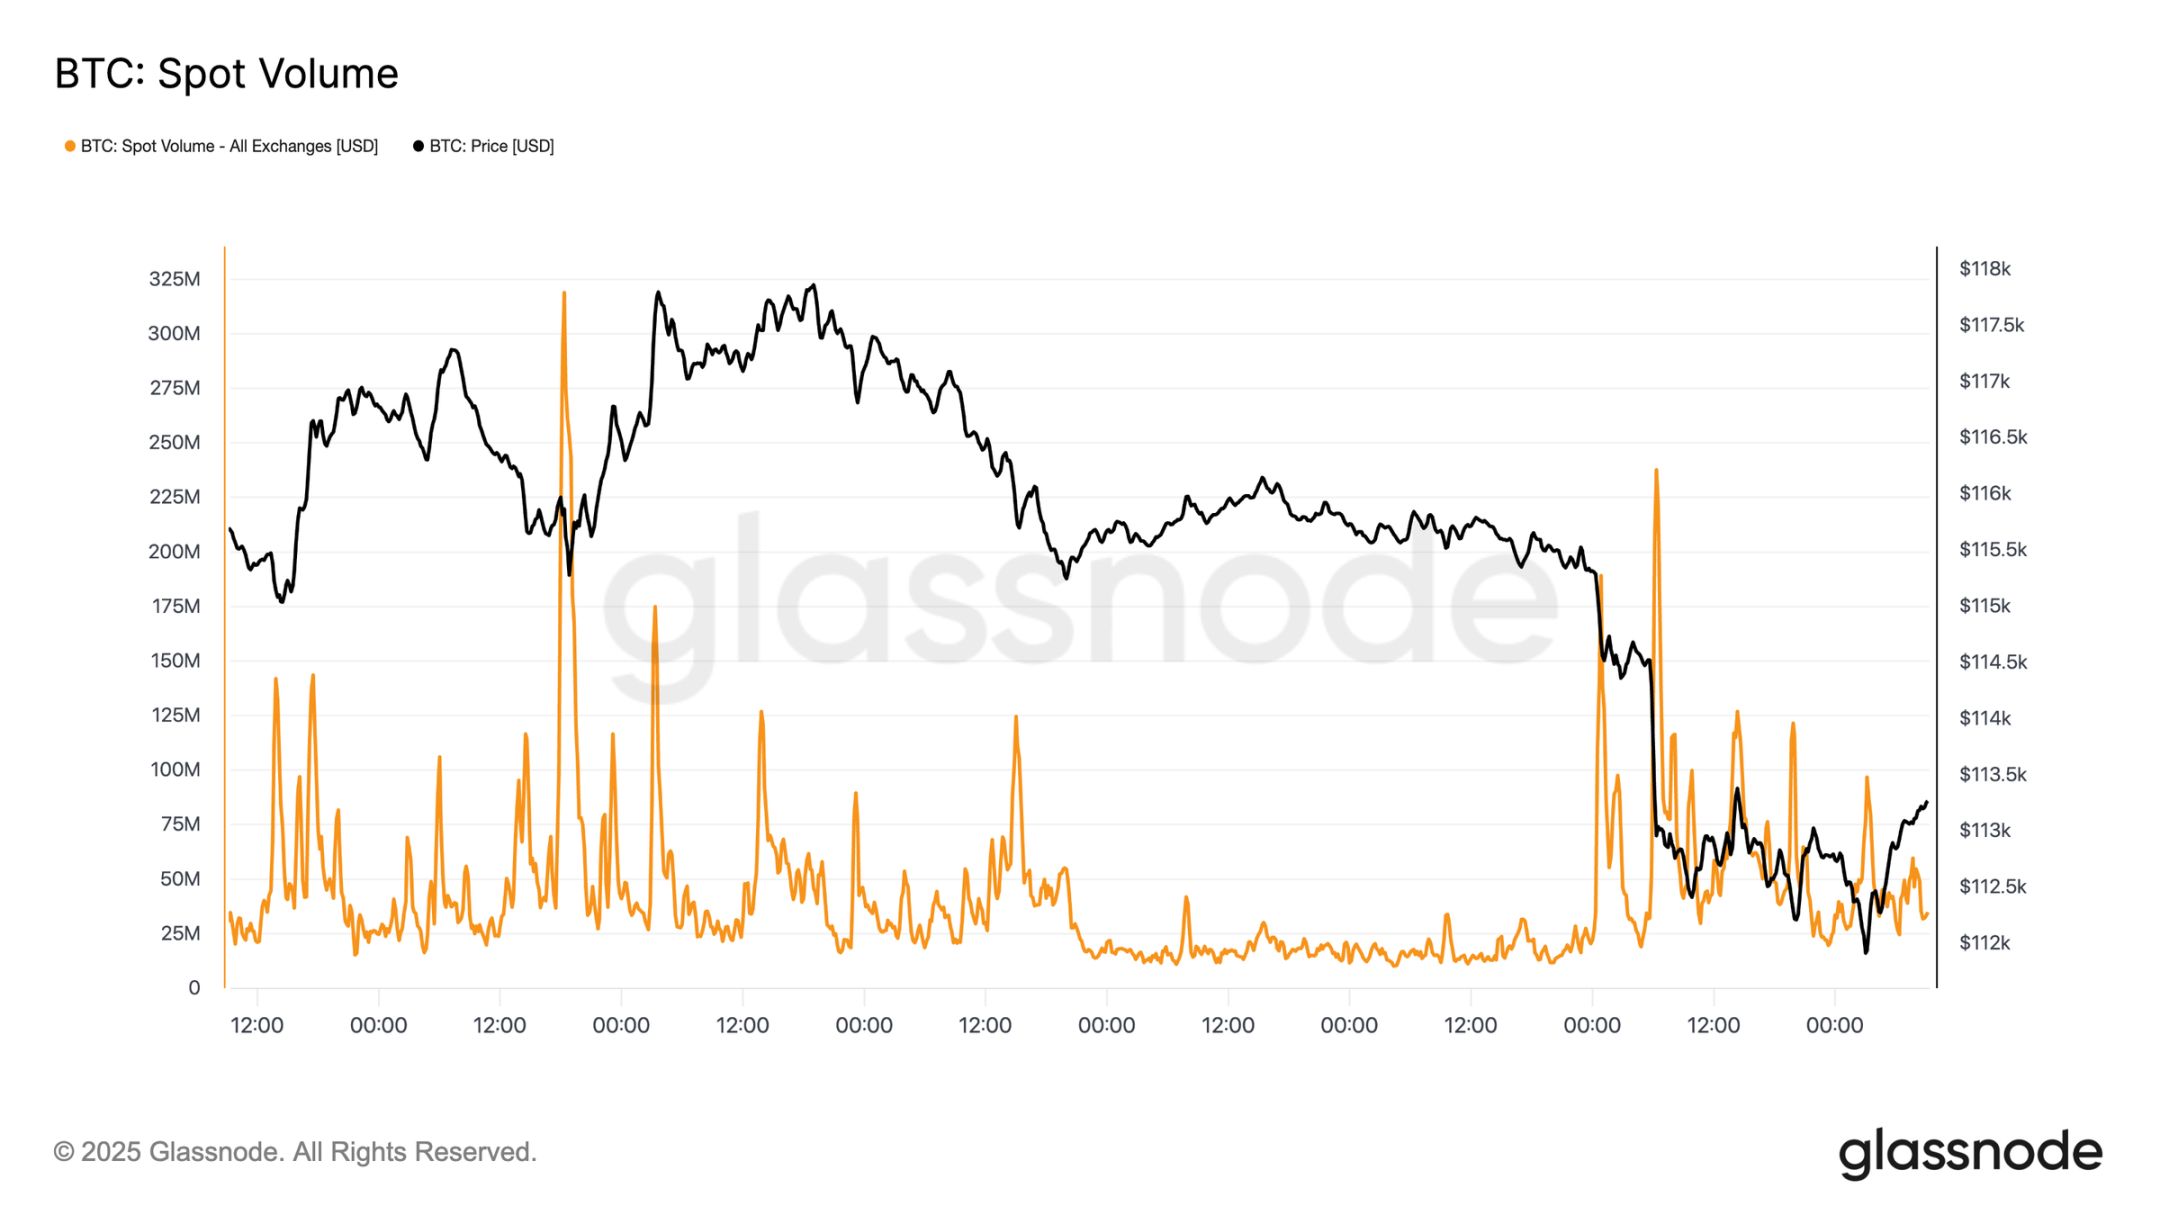
Spot Market Pressure
This vulnerability is evident in the spot market. During the post-FOMC sell-off, trading volume surged as forced liquidations and thin liquidity amplified the downside. Although painful, a temporary bottom formed near the short-term holder cost basis of $111,800.
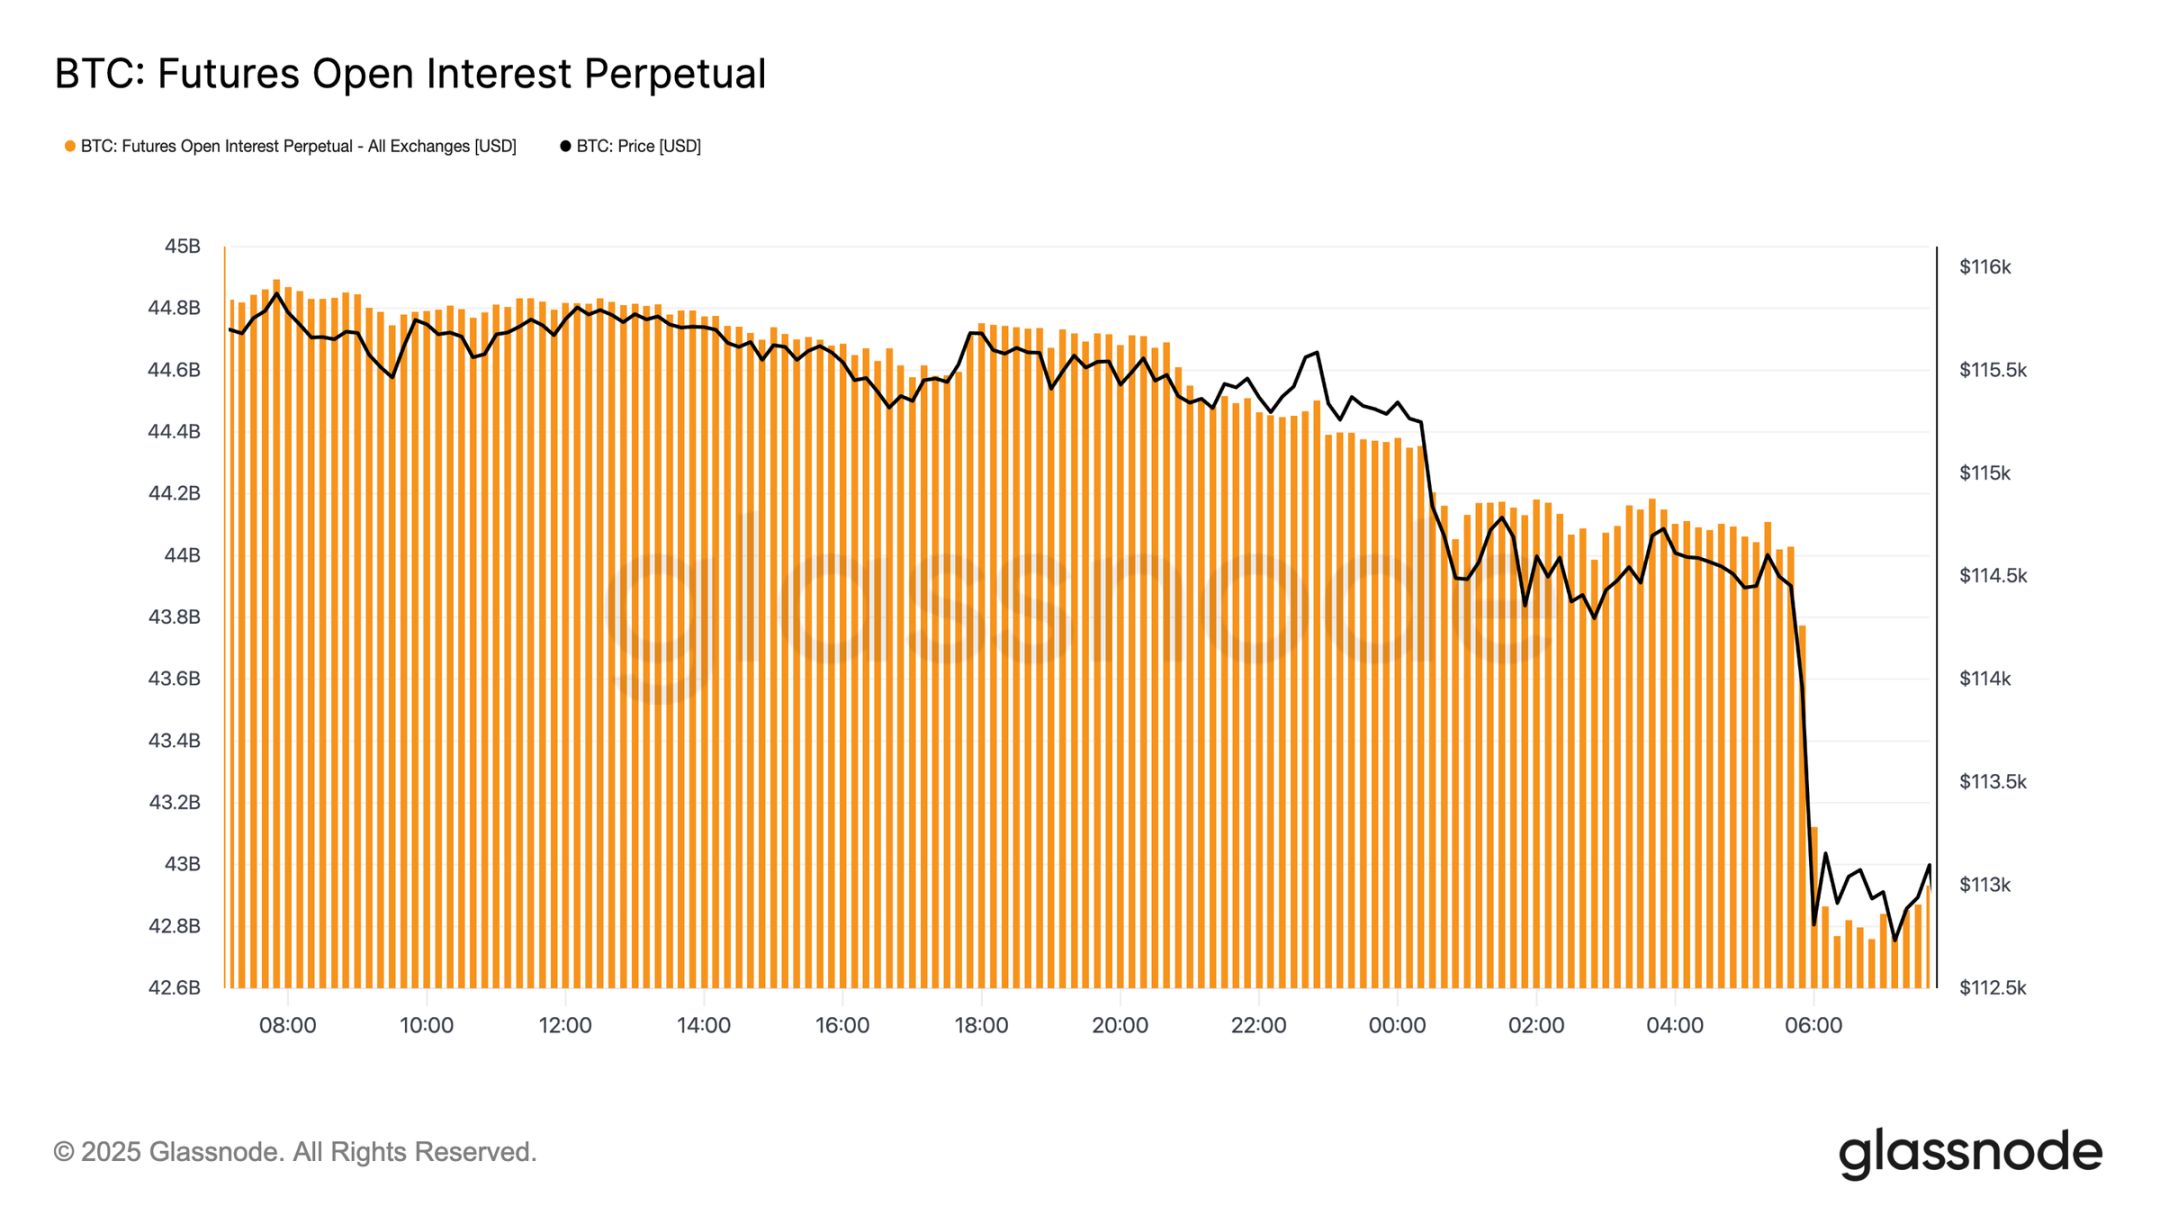
Futures Deleveraging
Meanwhile, as Bitcoin fell below $113,000, futures open interest dropped sharply from $44.8 billion to $42.7 billion. This deleveraging event flushed out leveraged longs, amplifying the downward pressure. While destabilizing in the short term, this reset helps clear excess leverage and restore balance to the derivatives market.
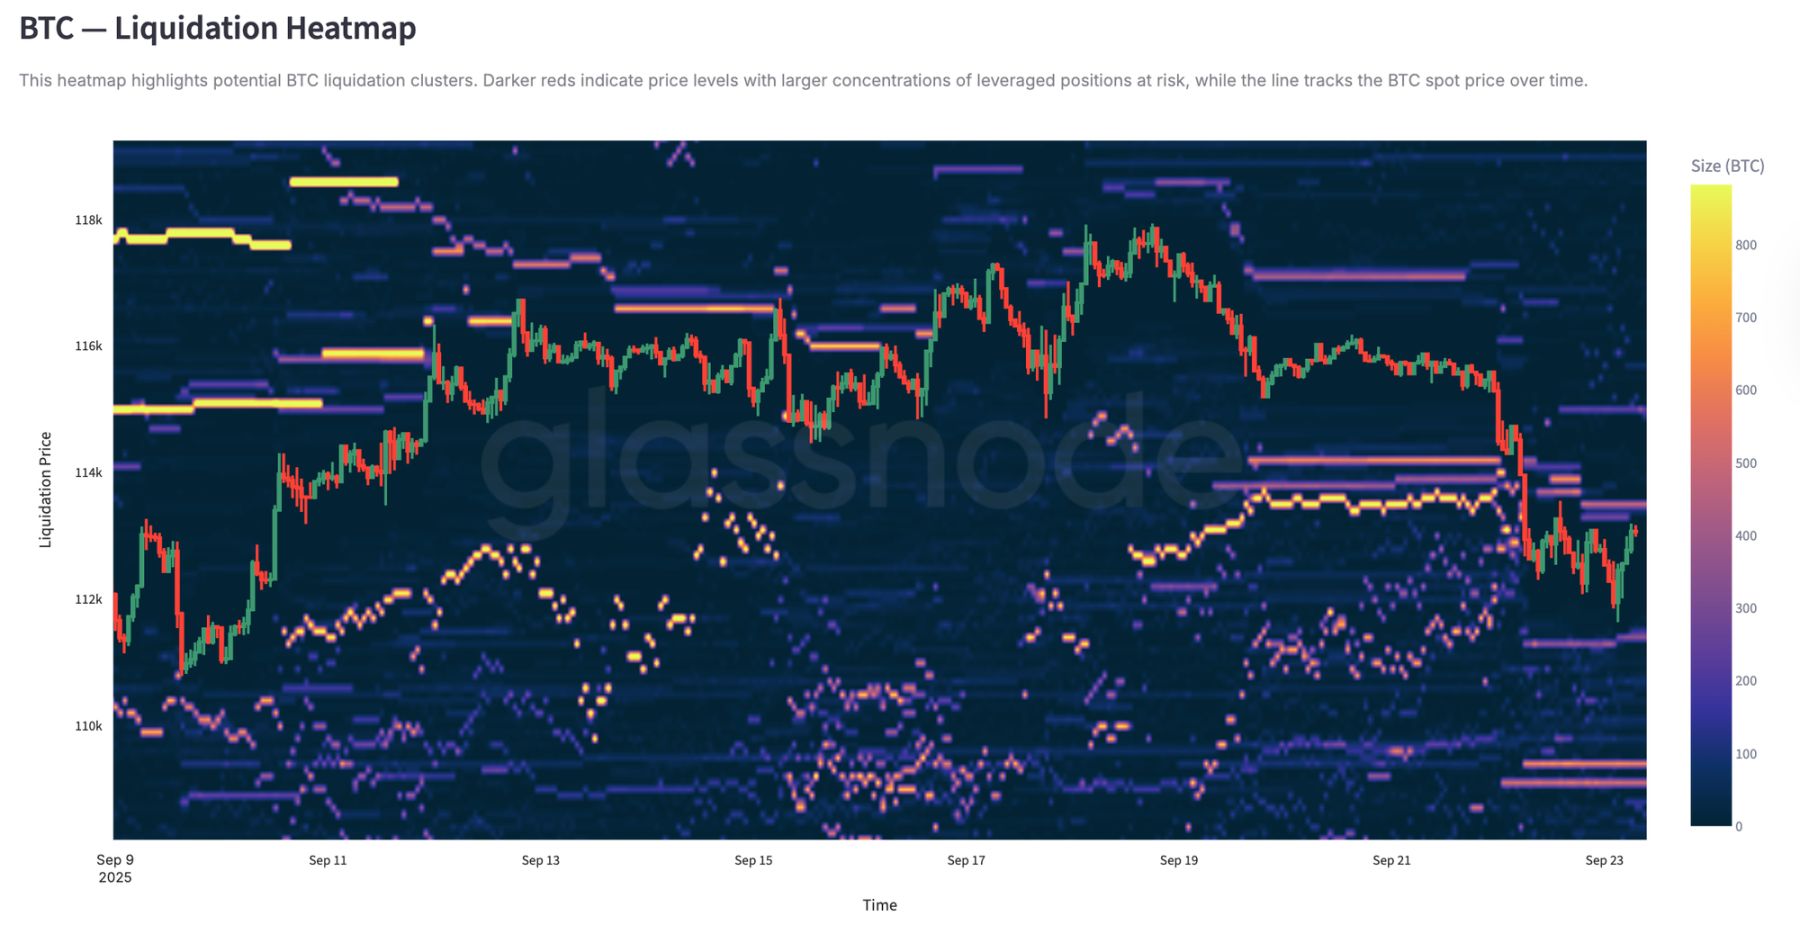
Liquidation Clusters
The perpetual contract liquidation heatmap provides more detail. As prices fell below the $114,000–$112,000 range, dense clusters of leveraged longs were wiped out, triggering mass liquidations and accelerating the decline. Risk pockets remain above $117,000, making the market vulnerable to liquidity-driven swings in both directions. Without stronger demand, the fragility near these levels increases the risk of further sharp volatility.
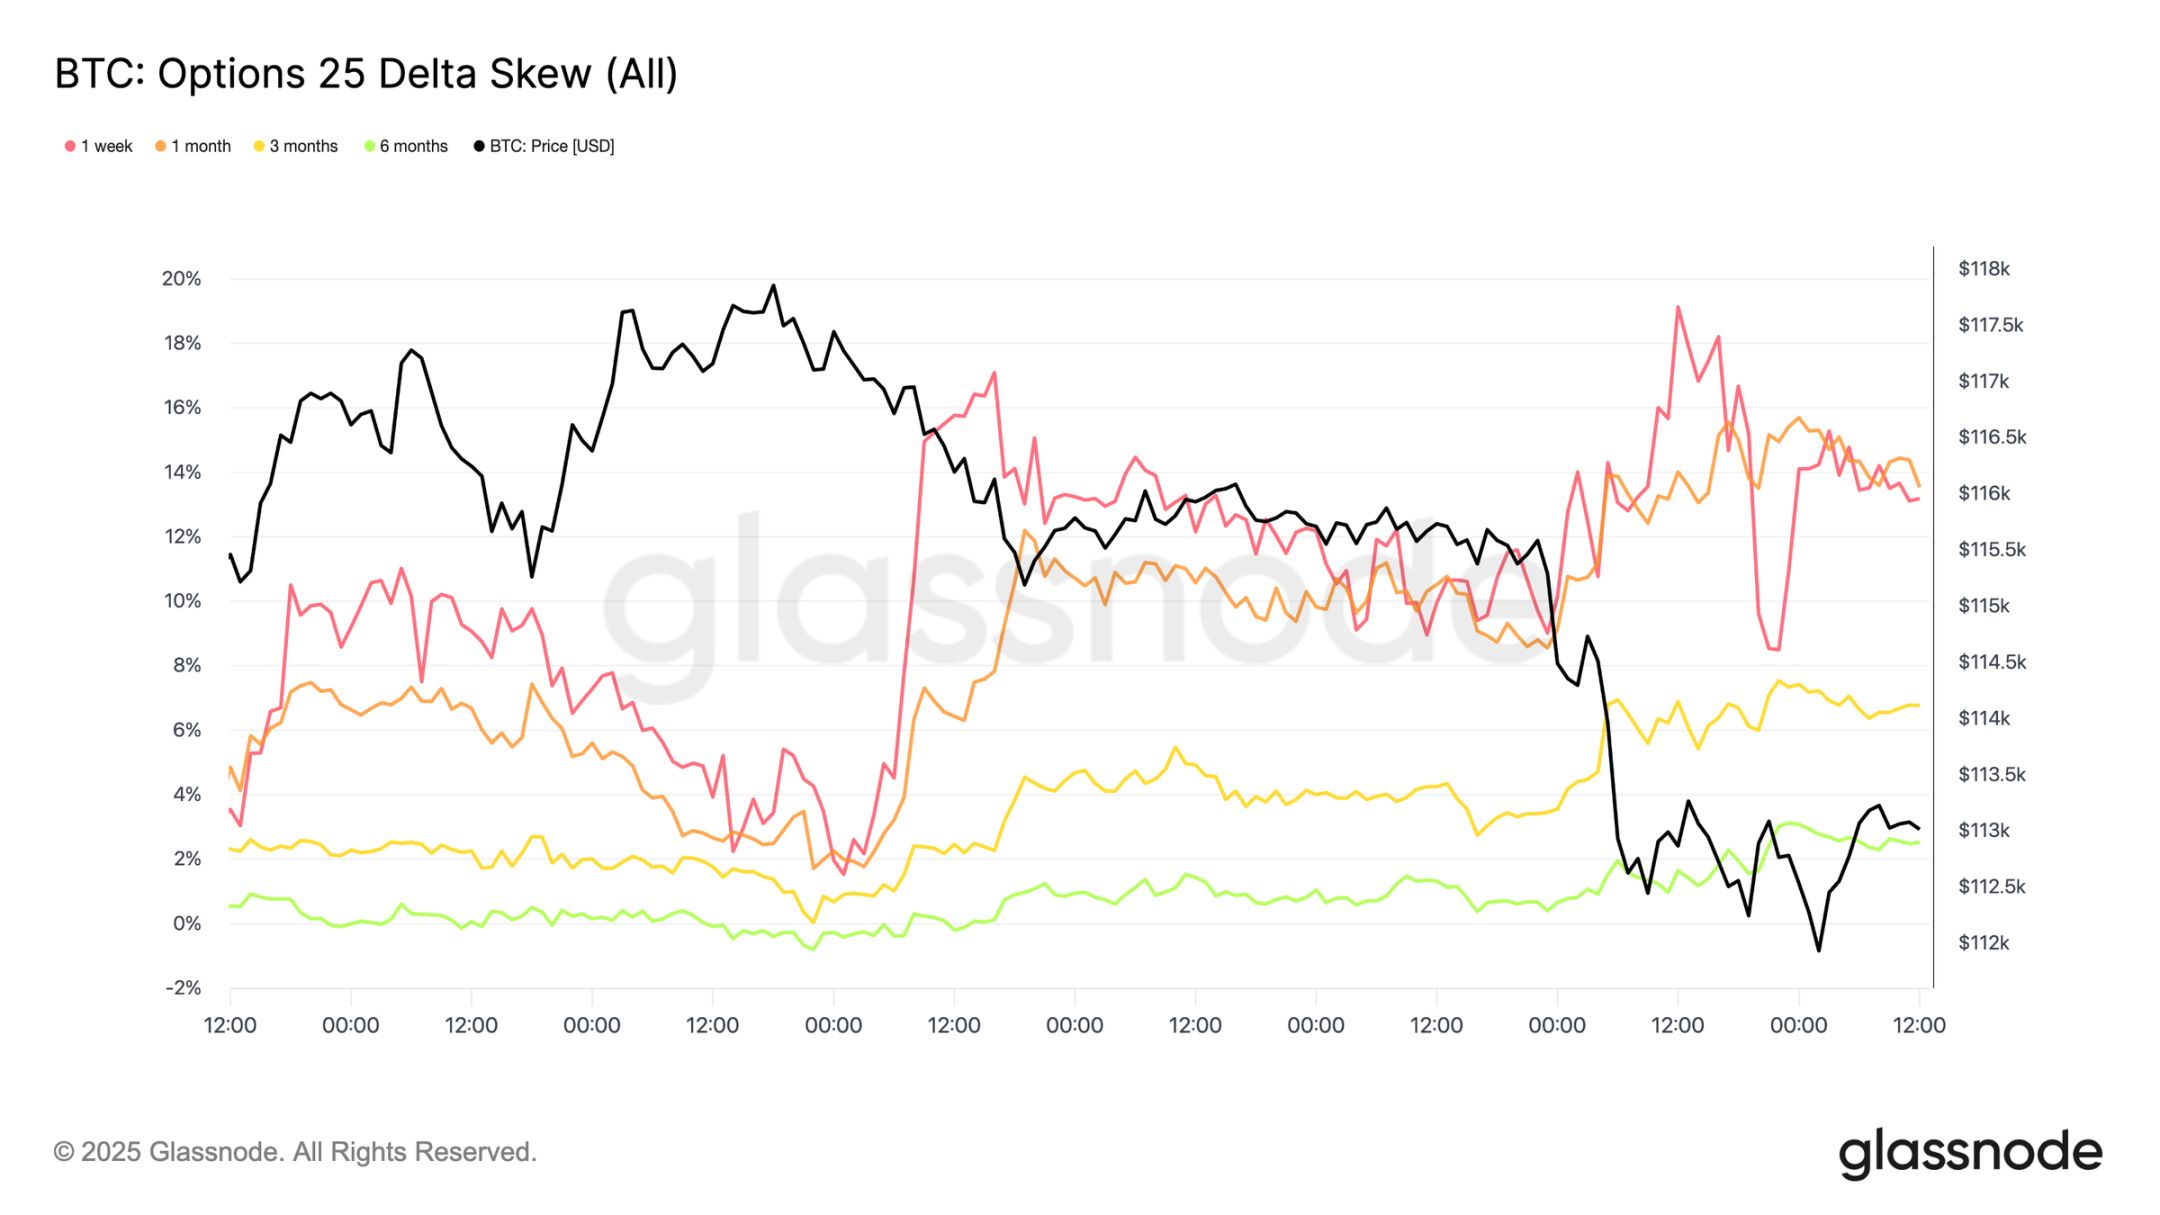
Options Market
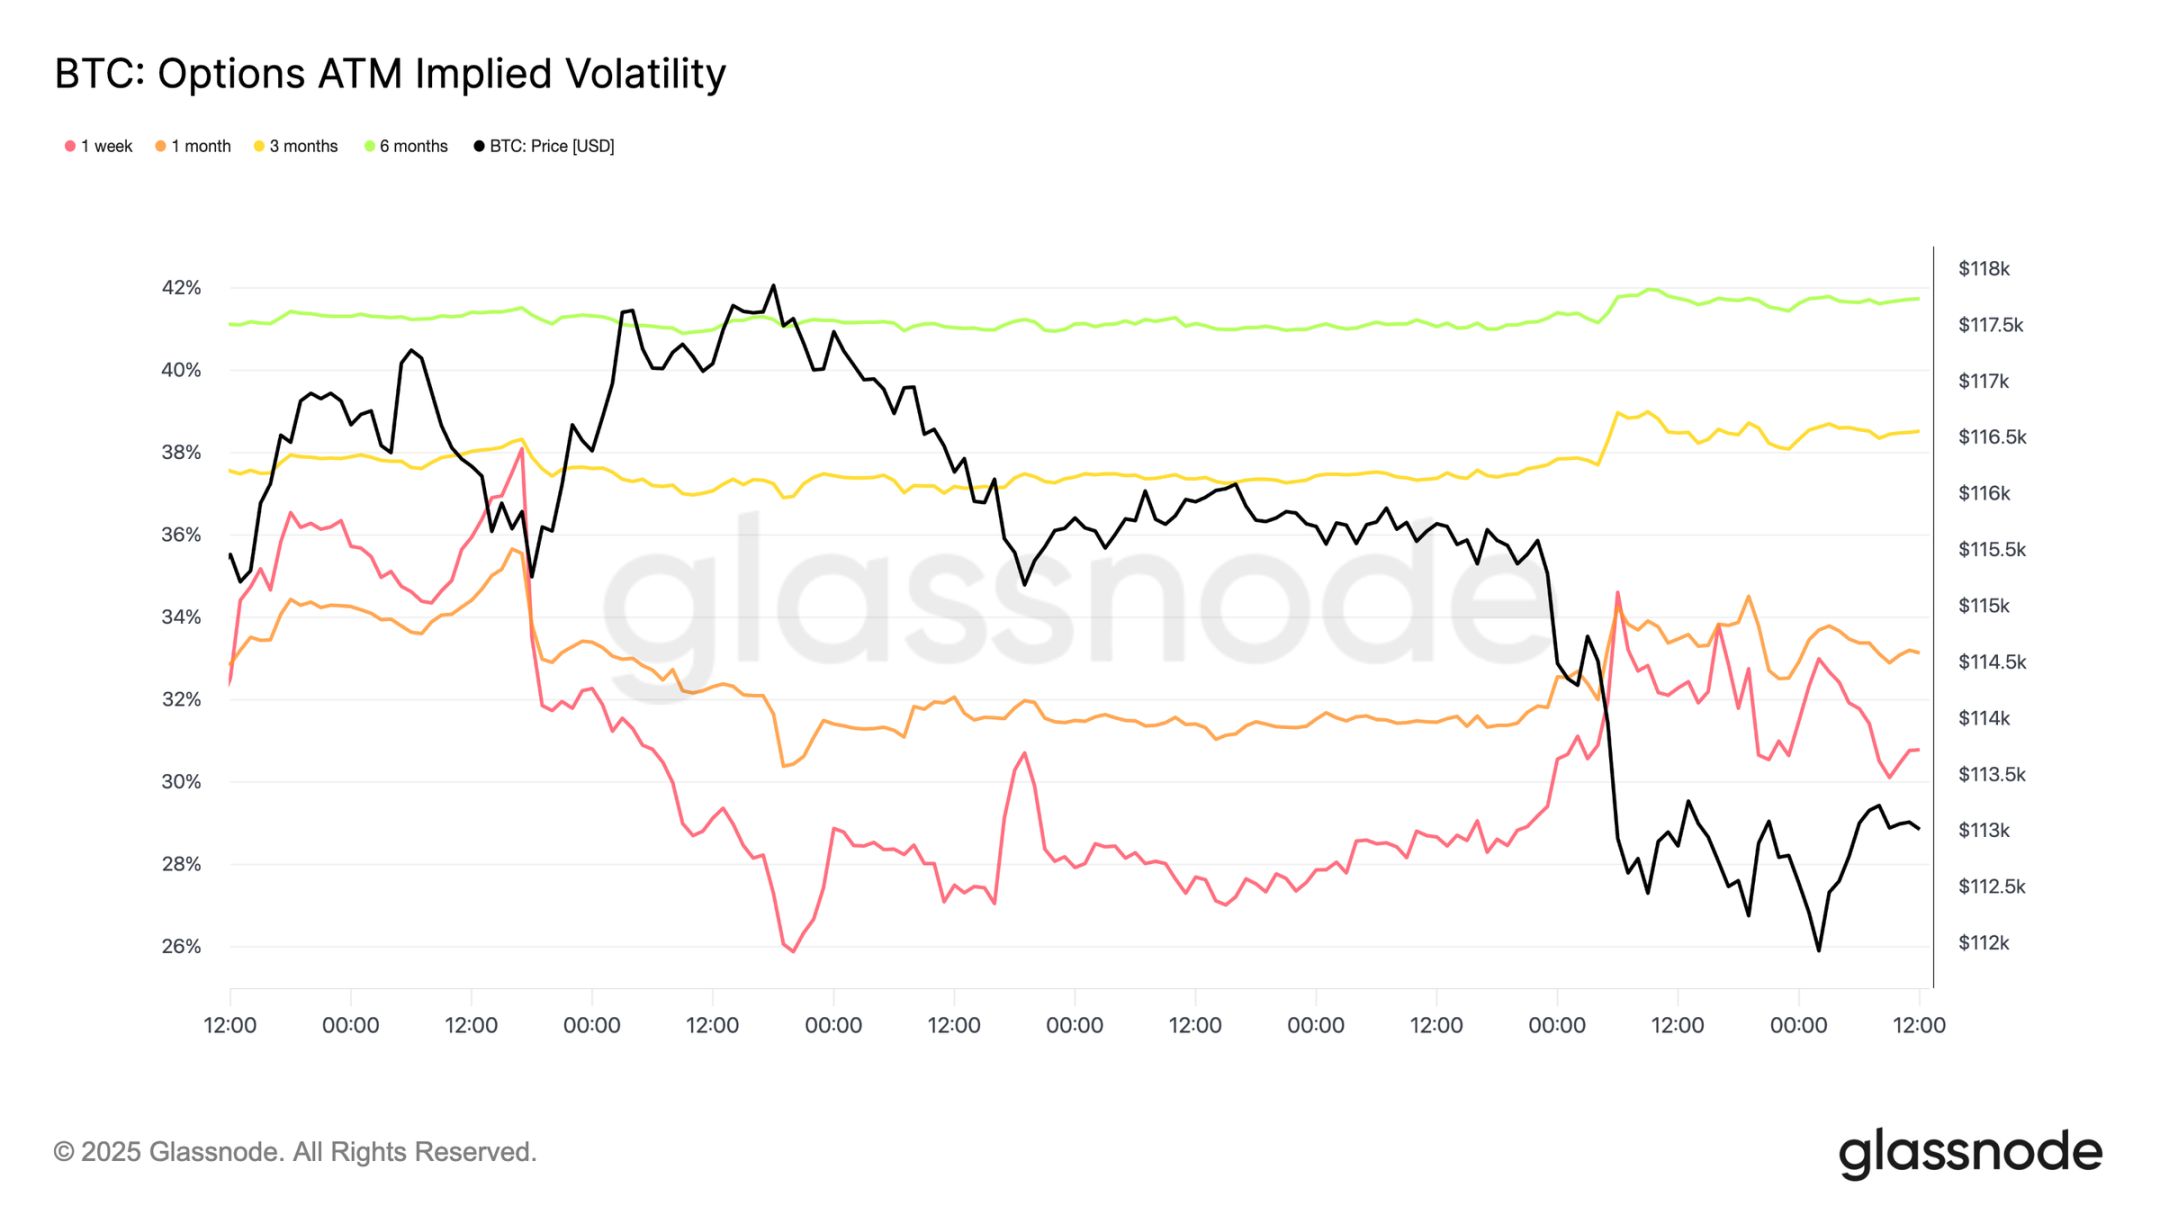
Volatility
Turning to the options market, implied volatility offers a clear view of how traders navigated a turbulent week. Two main catalysts shaped the market landscape: the first rate cut of the year and the largest liquidation event since 2021. As hedging demand built up, volatility climbed ahead of the FOMC meeting but quickly faded after the rate cut was confirmed, indicating the move was largely priced in. However, the violent futures liquidations on Sunday night reignited demand for protection, with one-week implied volatility leading the rebound and strength extending across all tenors.
Market Repricing Rate Cuts
After the FOMC meeting, there was aggressive demand for put options, either as protection against sharp declines or as a way to profit from volatility. Just two days later, the market realized this signal with the largest liquidation event since 2021.
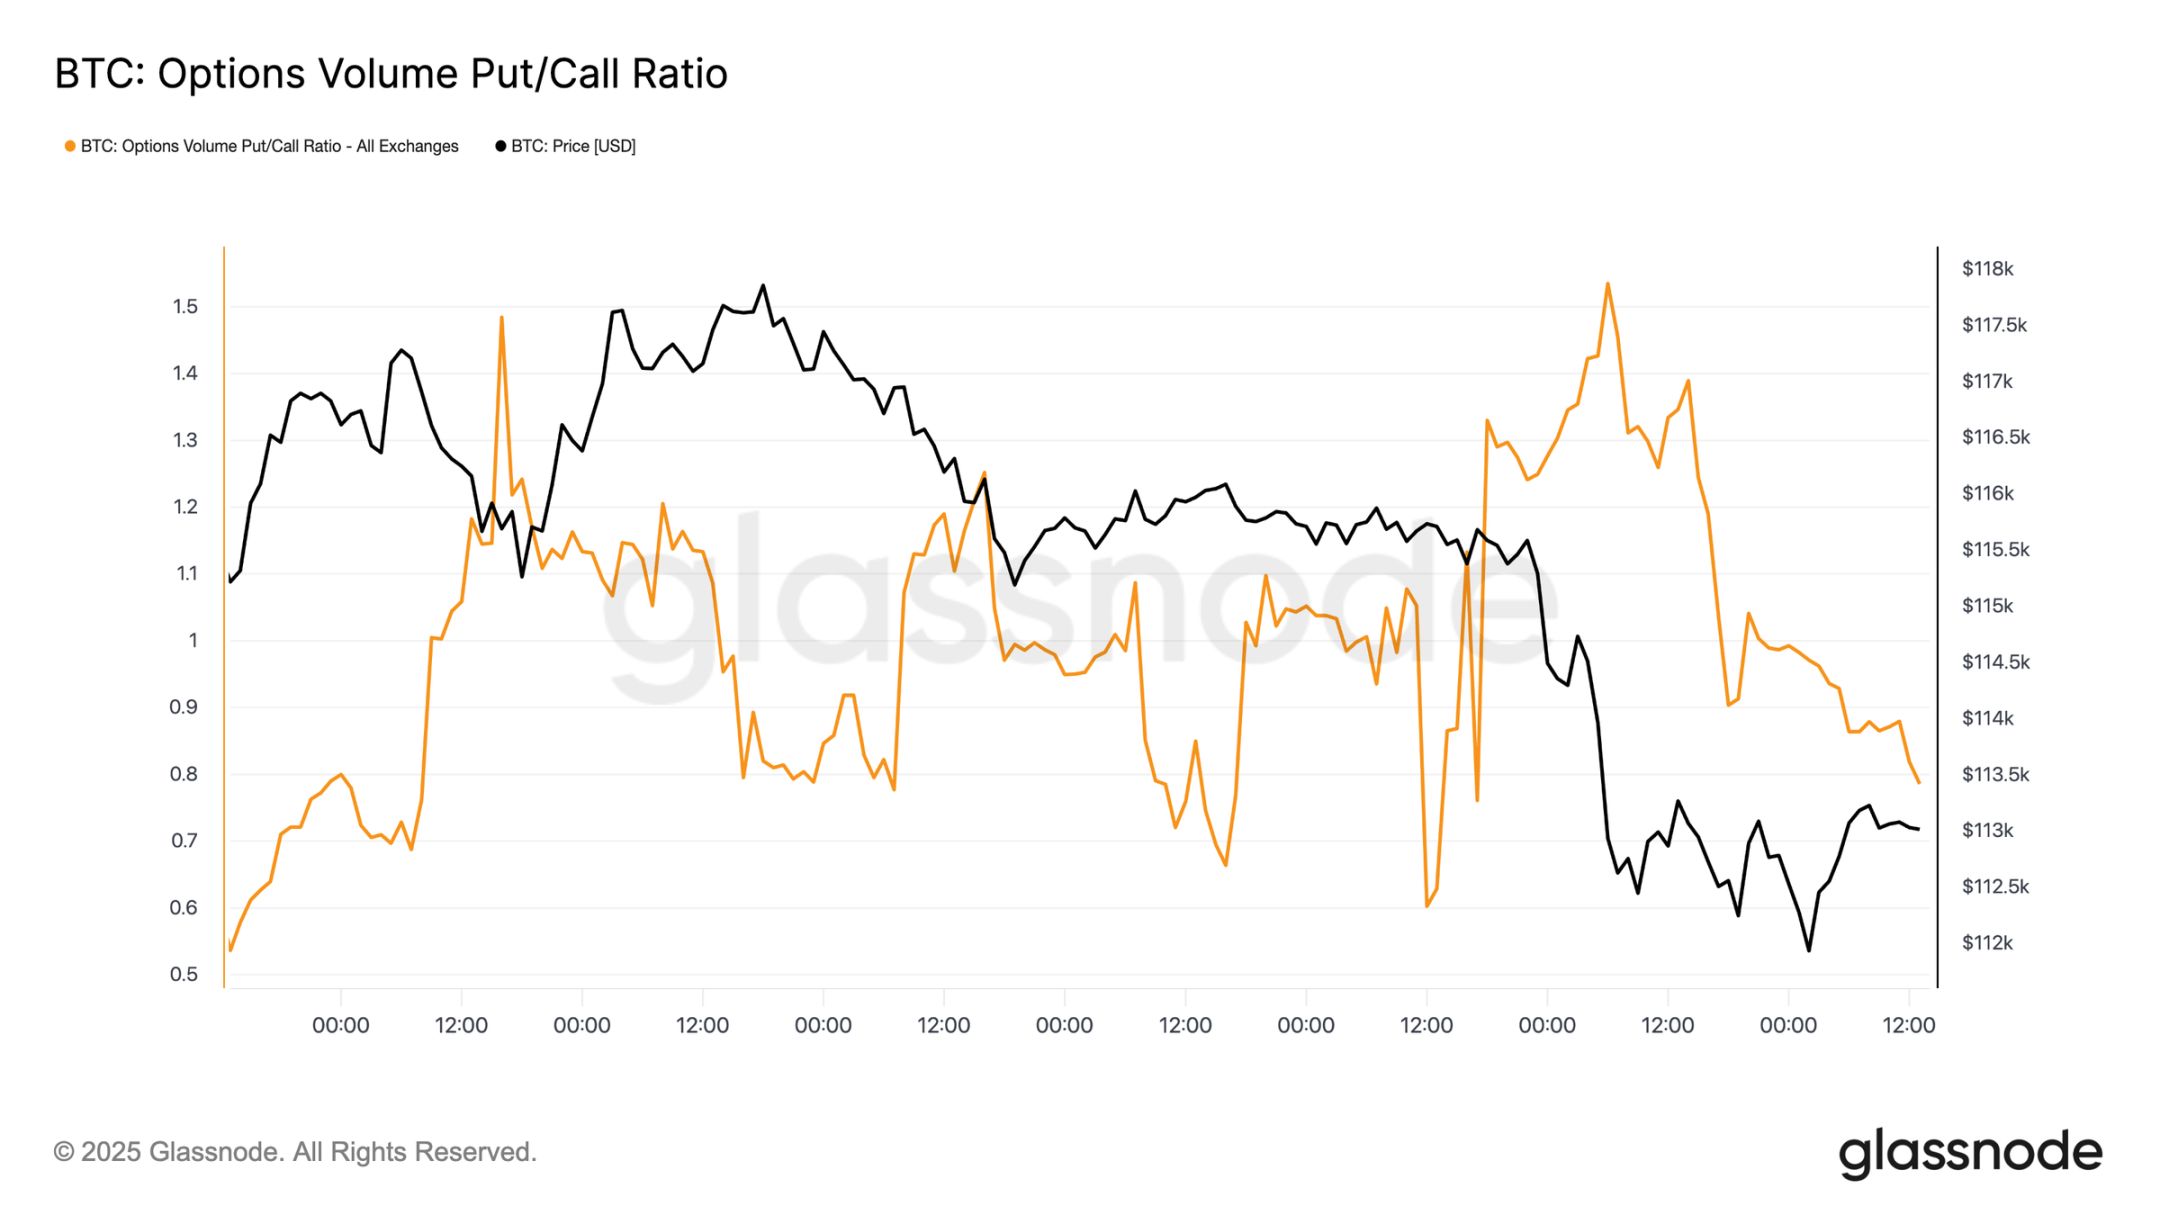
Put/Call Option Flows
After the sell-off, the put/call option volume ratio trended downward as traders locked in profits on in-the-money puts, while others rotated into cheaper calls. Short- and medium-term options remain heavily skewed toward puts, making downside protection expensive relative to upside. For participants with a constructive view toward year-end, this imbalance creates opportunities—either to accumulate calls at relatively low cost or to finance them by selling overpriced downside risk exposure.
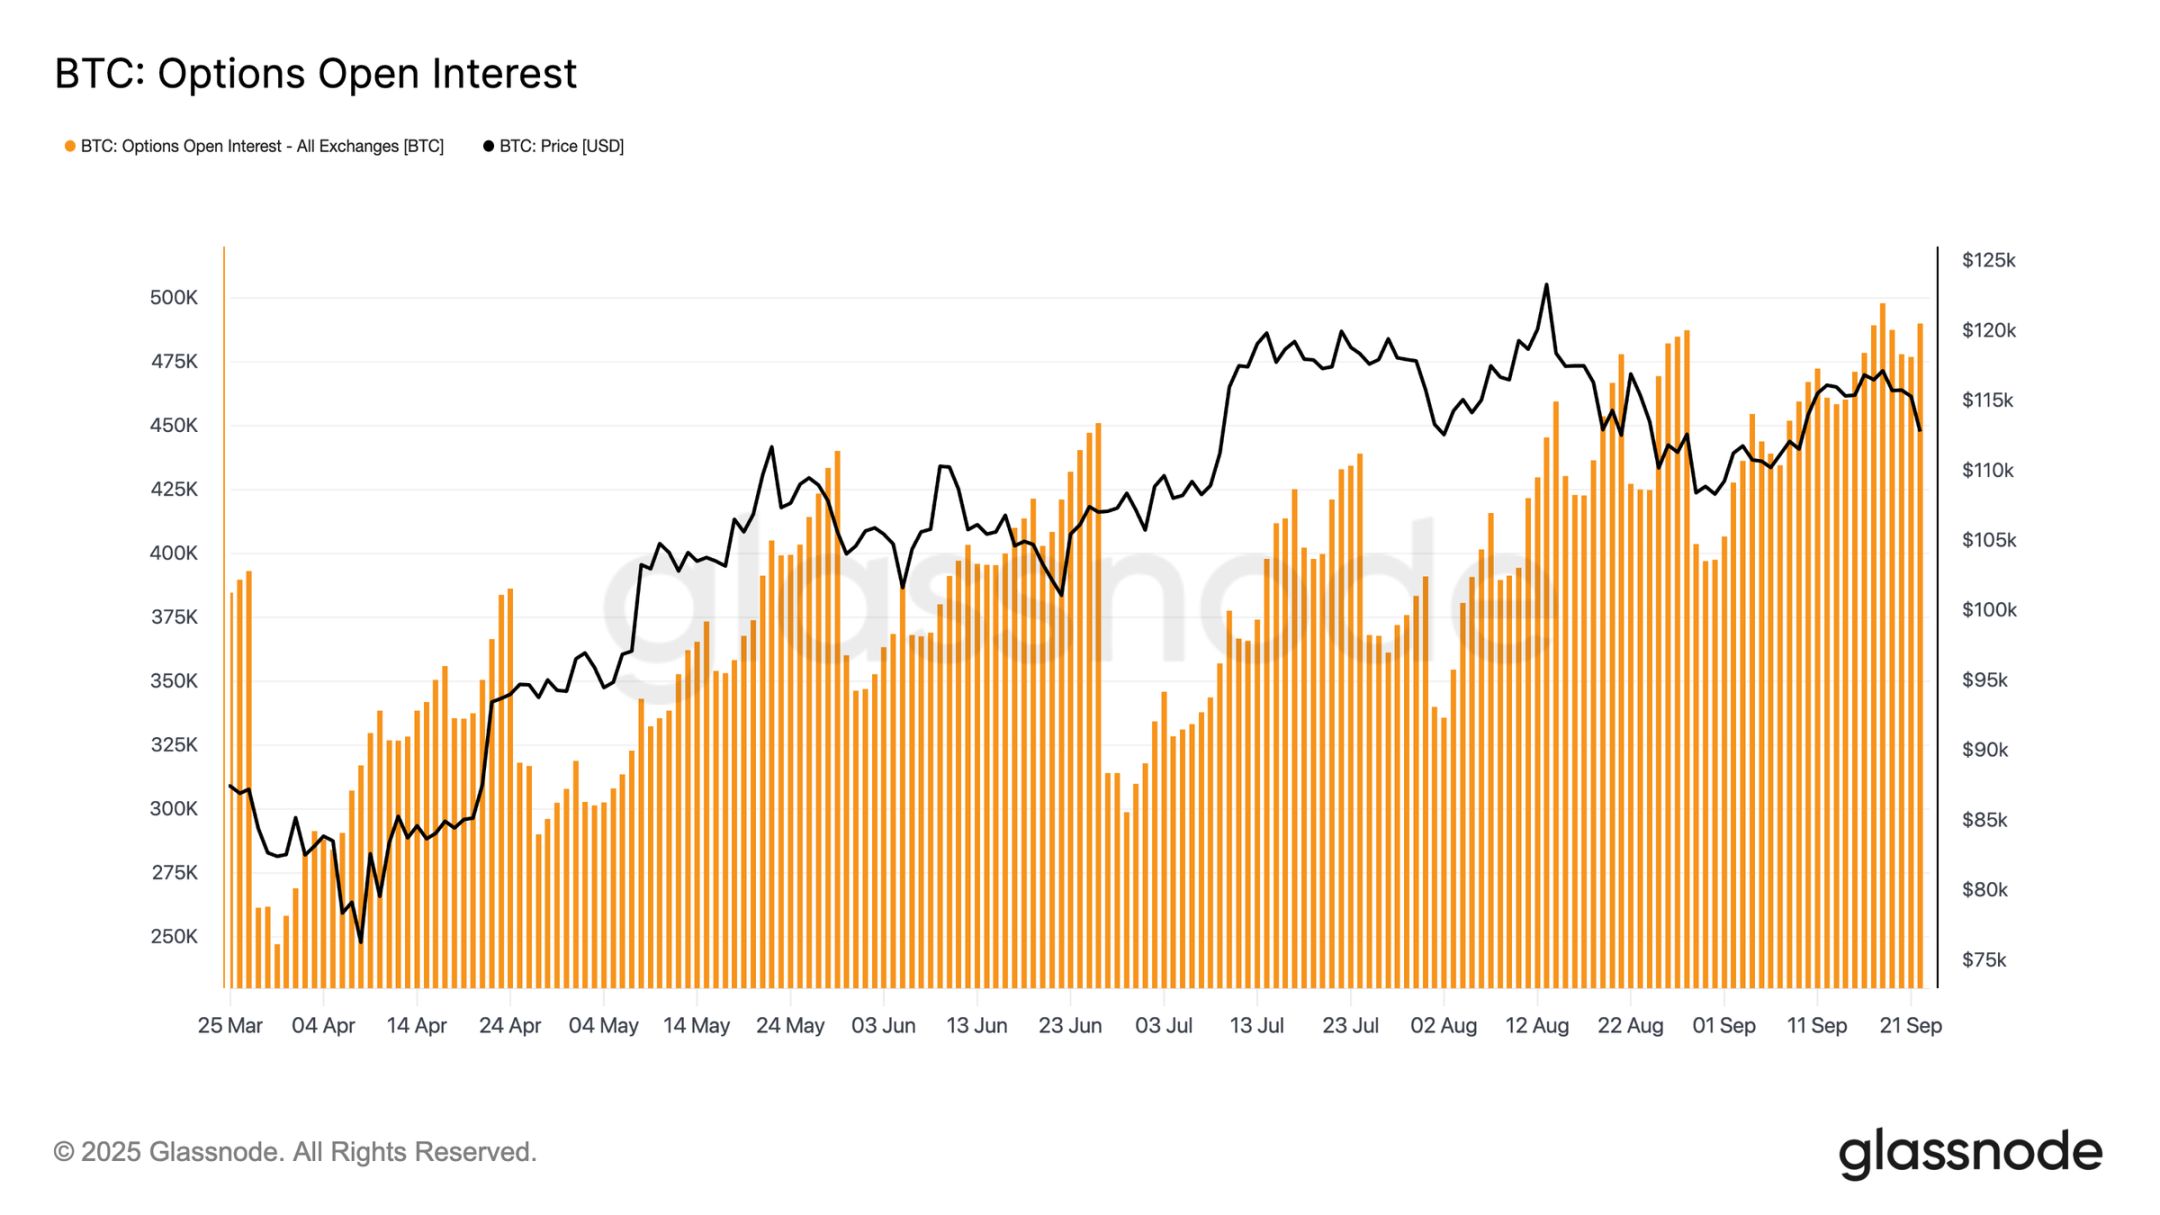
Options Open Interest
Total options open interest hovers near all-time highs and will drop sharply at Friday’s expiry, before the market rebuilds into December. Currently, the market is in a peak zone, where even small price swings force market makers into aggressive hedging. Market makers are short on the downside and long on the upside, a structure that amplifies sell-offs while limiting rebounds. This dynamic skews near-term volatility risk to the downside, increasing fragility until expiry clears and positions reset.
Conclusion
Bitcoin’s post-FOMC pullback reflects a typical “buy the rumor, sell the news” pattern, but the broader context points to growing exhaustion. The current 12% drawdown is mild compared to past cycles, but it comes after three major waves of capital inflows that boosted realized market cap by $67.8 billion—almost double the previous cycle. Long-term holders have already realized profits on 3.4 million BTC, highlighting the scale and maturity of selling in this rally.
Meanwhile, ETF inflows that previously absorbed supply have slowed, creating a fragile balance. Spot trading volume has surged due to forced selling, futures have seen sharp deleveraging, and the options market is pricing in downside risk. These signals collectively indicate that market momentum is running out, with liquidity-driven volatility dominating.
Unless institutional and holder demand aligns again, the risk of a deep cooldown remains high.
Disclaimer: The content of this article solely reflects the author's opinion and does not represent the platform in any capacity. This article is not intended to serve as a reference for making investment decisions.
You may also like
Ethereum Staking Weekly Report December 1, 2025
🌟🌟Core Data on ETH Staking🌟🌟 1️⃣ Ebunker ETH staking yield: 3.27% 2️⃣ stETH...

The Blood and Tears Files of Crypto Veterans: Collapses, Hacks, and Insider Schemes—No One Can Escape
The article describes the loss experiences of several cryptocurrency investors, including exchange exits, failed insider information, hacker attacks, contract liquidations, and scams by acquaintances. It shares their lessons learned and investment strategies. Summary generated by Mars AI This summary was produced by the Mars AI model, and the accuracy and completeness of its generated content are still in the process of iterative improvement.

Mars Morning News | Federal Reserve officials to advance stablecoin regulatory framework; US SEC Chairman to deliver a speech at the New York Stock Exchange tonight
Federal Reserve officials plan to advance the formulation of stablecoin regulatory rules. The SEC Chair will deliver a speech on the future vision of capital markets. Grayscale will launch the first Chainlink spot ETF. A Coinbase executive has been sued by shareholders for alleged insider trading. The cryptocurrency market fear index has dropped to 23. Summary generated by Mars AI This summary was generated by the Mars AI model, and the accuracy and completeness of its content are still in the process of iterative updates.

OECD's latest forecast: The global interest rate cut cycle will end in 2026!
According to the latest forecast from the OECD, major central banks such as the Federal Reserve and the European Central Bank may have few "bullets" left under the dual pressures of high debt and inflation.