Date: Tue, Nov 04, 2025 | 06:20 PM GMT
The cryptocurrency market continues to swing wildly, erasing nearly 5% from the total market capitalization today. Both Bitcoin (BTC) and Ethereum (ETH) have suffered sharp declines, contributing to more than $1.18 billion in total liquidations — with an overwhelming $1.0 billion coming from long positions.
BTC alone has dropped around 6% in the past 24 hours, but beneath this wave of bearish momentum, the chart is flashing something potentially more optimistic — a key moving average (MA) support that could once again play a decisive role in shaping Bitcoin’s next big move.
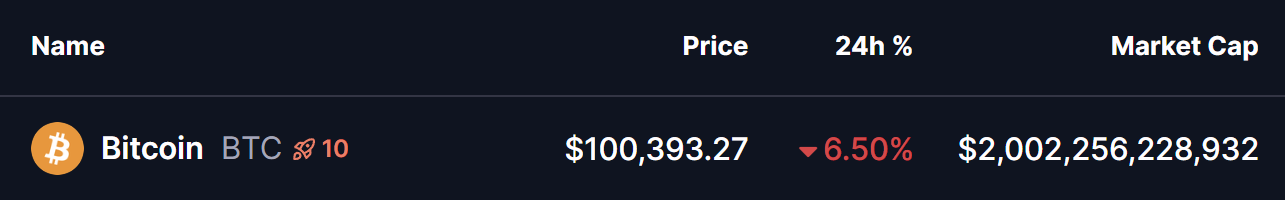 Source: Coinmarketcap
Testing Crucial 365-Day MA Support
On the daily timeframe, BTC has once again dropped to test its crucial 365-day MA — a level that has acted as a springboard for previous major rallies.
Back in August 2024 and April 2025, Bitcoin experienced sharp corrections that dragged its price to the same 365-day MA region, both times resulting in strong rebound rallies that carried BTC to new local highs.
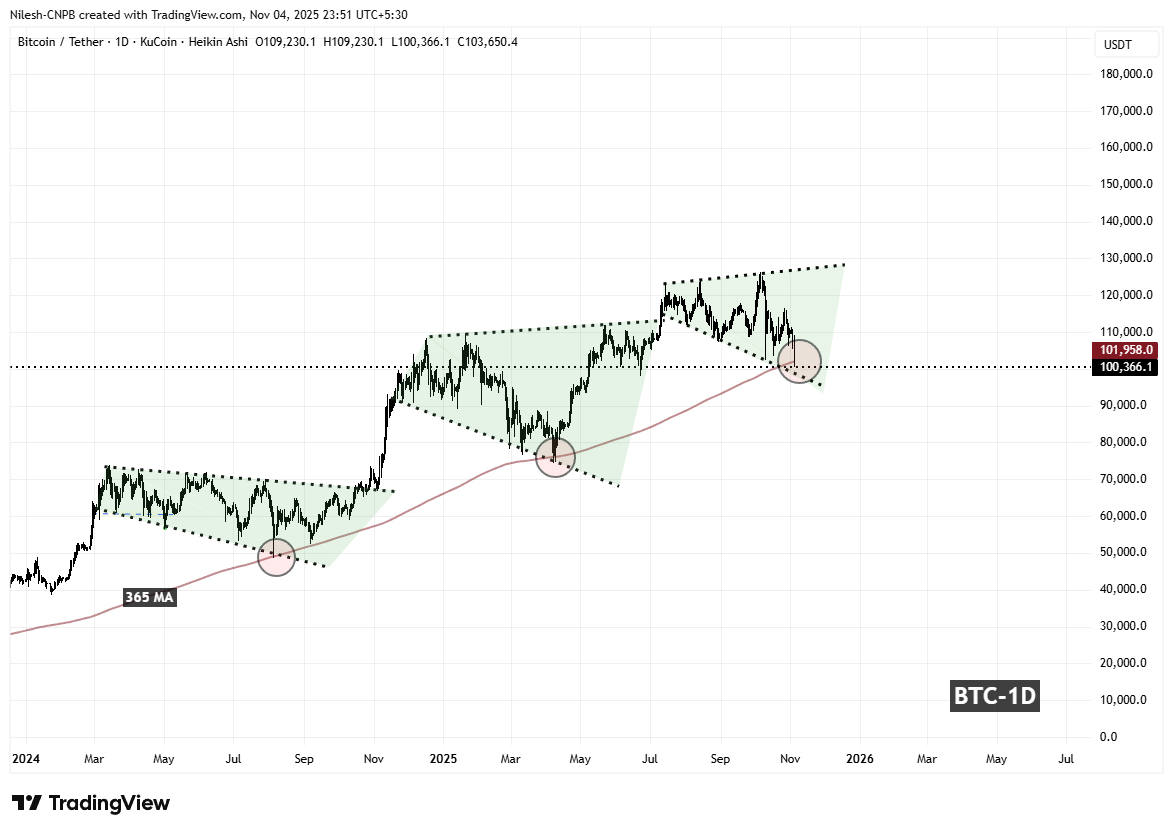 BTC Daily Chart/Coinsprobe (Source: Tradingview)
Now, history seems to be rhyming. The latest correction has pushed BTC down to the $100,000 zone, where it is currently trading just below the 365-day MA ($101,958). The price also aligns with the lower boundary of a symmetrical broadening wedge, adding further technical confluence to this critical support area.
What’s Next for Bitcoin?
If the 365-day MA fractal support holds once again, BTC could be poised for a sharp recovery bounce from the $98K–$100K range. A rebound from this area could mark the end of the current deep correction phase and potentially set the stage for a move toward new all-time highs in the coming months.
However, the bullish fractal is not guaranteed. A decisive breakdown below $98,000 and failure to reclaim the 365-day MA could trigger another wave of selling, possibly extending the correction before any meaningful reversal occurs.